


In this Ethereum daily analysis for 07 January 2026, we focus on the shift in momentum after price failed to reach the prior swing high. Our technical analysis highlights a fresh bearish signal at resistance while the broader structure still reflects a larger bullish impulse in correction.
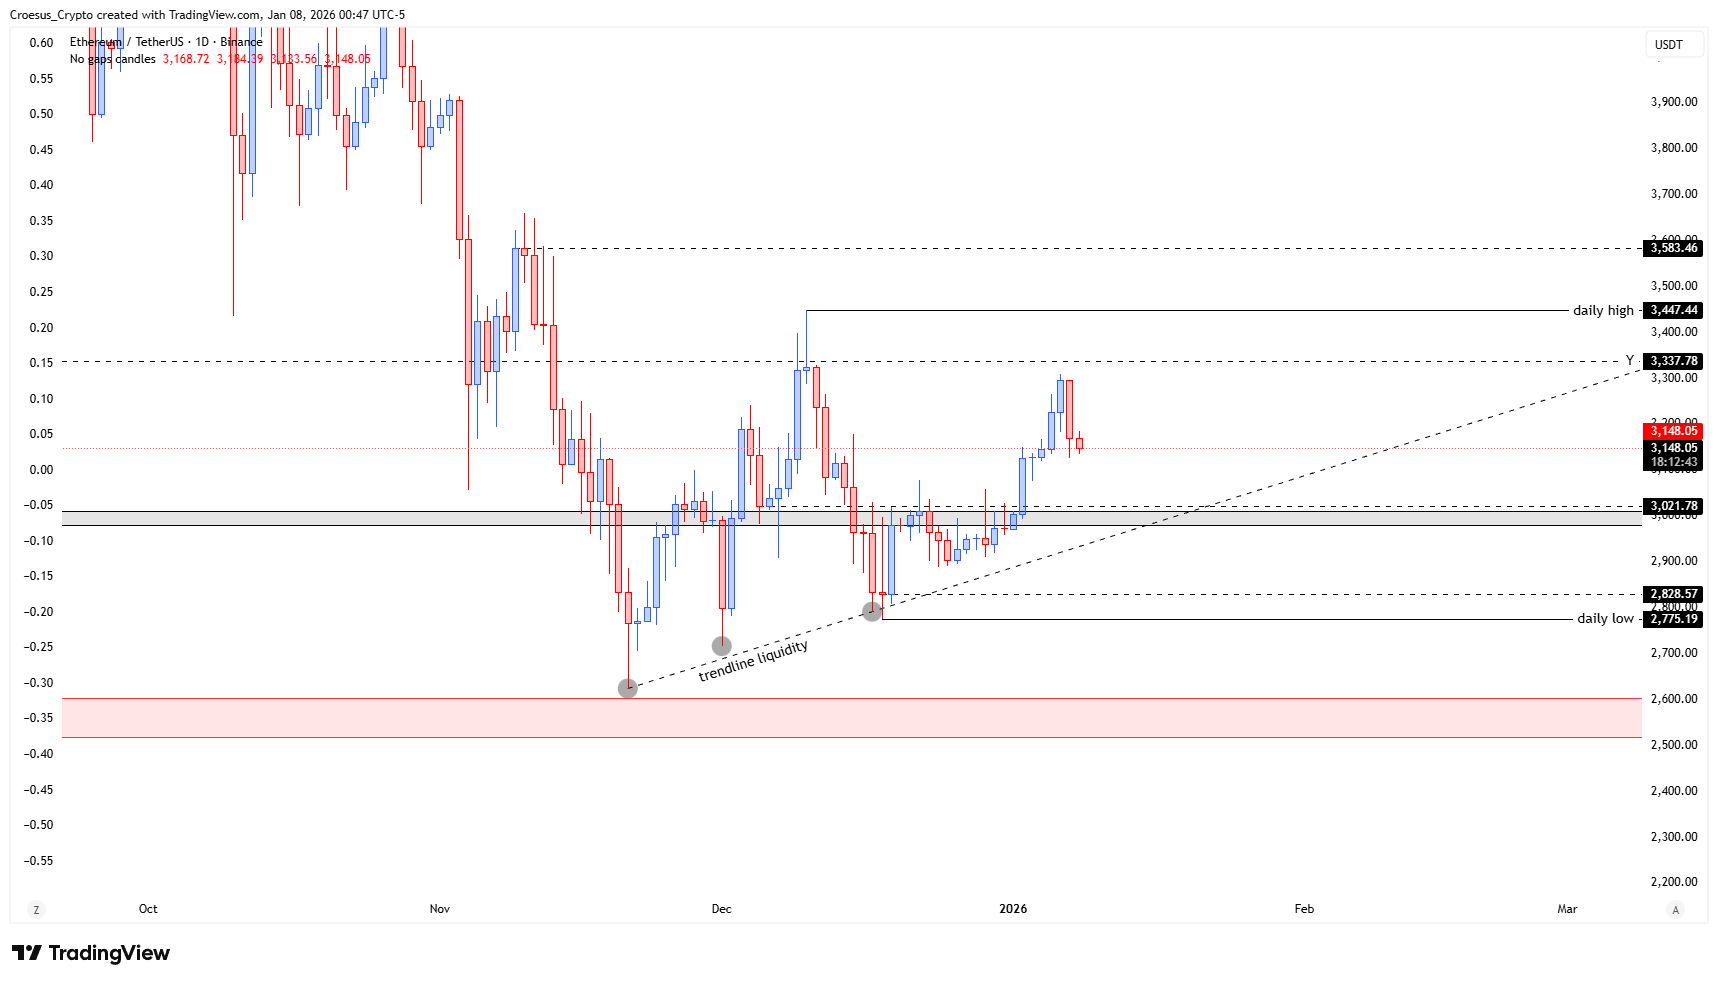
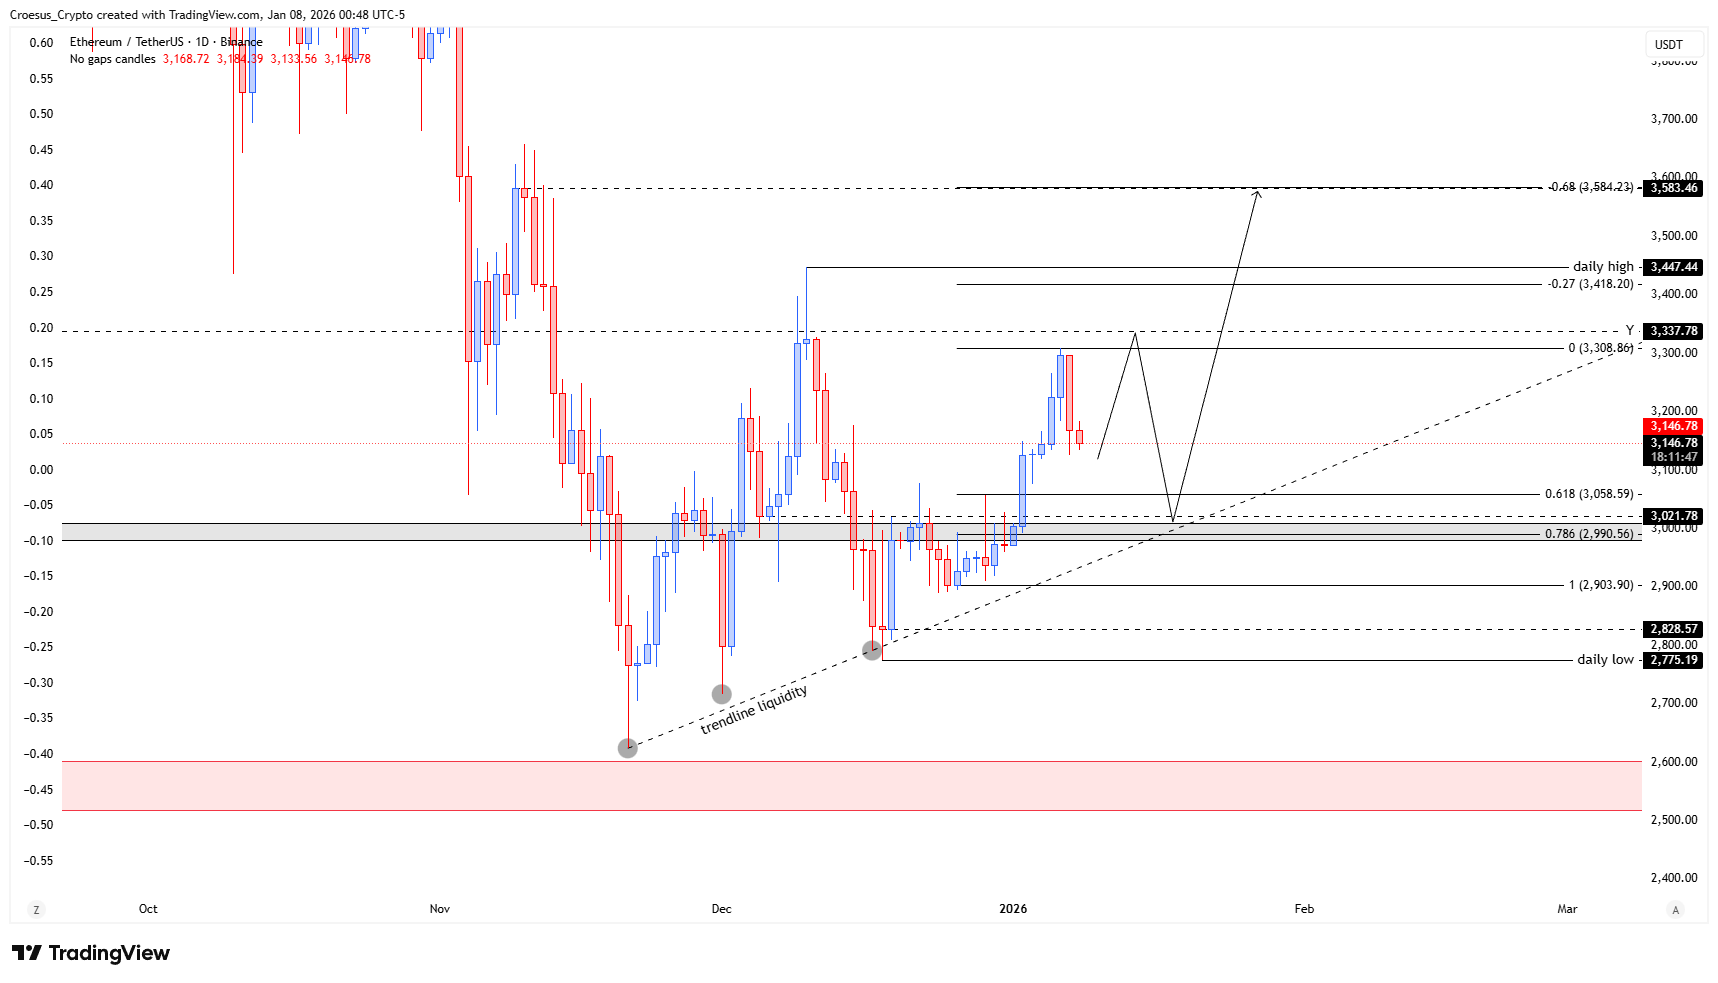
ETHUSDT daily chart 8 January 2026 showing bearish engulfing candle, prior highs, and key support around $3,000 and $2,600.
Technical Analysis Key Points
- After failing to reach the prior high, we saw price showing us a clear switch of momentum and printing a bearish engulfing candle.
- This must be considered as the corrective phase of the bullish impulse. Within this correction we might see a retest of the highs (as a part of an ABC correction). Retesting the $3.000 zone is at this moment the target.
- We still have to remember that a monthly level at $2.600 has not been fully retested yet.
Market Structure Analysis
Our Ethereum daily analysis shows that buyers lost strength just below the prior high near the $3,337–$3,447 resistance band. The resulting bearish engulfing candle signals a clear momentum switch and marks this zone as strong support resistance. Given the preceding multi-day advance from the $2,775 daily low, we treat the current move as a corrective phase within a broader bullish structure.
The correction is likely unfolding as an ABC pattern. Price could first attempt a minor bounce or retest of local highs before rotating lower toward the main support around $3,000–$3,020, where prior consolidation, trendline liquidity and a key horizontal level converge. Below that, the untested monthly level at $2,600 remains an important downside magnet if selling accelerates, especially if the $2,828–$2,775 area fails to hold as interim support. Fibonacci confluences around these zones further validate them as potential reaction points in this technical analysis.
Key Levels and Scenarios
Bullish scenario: holding the $3,000–$3,020 area and reclaiming $3,337 would suggest the correction has completed and opens the path back toward the daily high around $3,447 and the higher resistance near $3,583.
Key levels to watch:
$3,583 – Major resistance and potential upside objective.
$3,447 – Daily high and key breakout level.
$3,337 – Local resistance; reclaiming it would confirm renewed strength.
$3,020–$3,000 – Primary corrective target and key support zone.
$2,600 – Untested monthly support and deeper downside target.
Trading Implications
From a trading perspective, we treat the current move as corrective; we look for confirmation signals around $3,000 for potential long setups, while any fresh rejection near $3,337–$3,447 favours short-term mean-reversion trades with tight risk management.
This content is for educational purposes only and is not financial advice or a recommendation to buy or sell any asset.