


ETH Marketcap / Ethereum
ETH daily analysis 07/04/2026. Ethereum is printing a short-term bullish push, but our technical analysis remains cautious because price is pressing directly into a key resistance area at the daily highs, where failed breakouts often rotate back into the prior range.
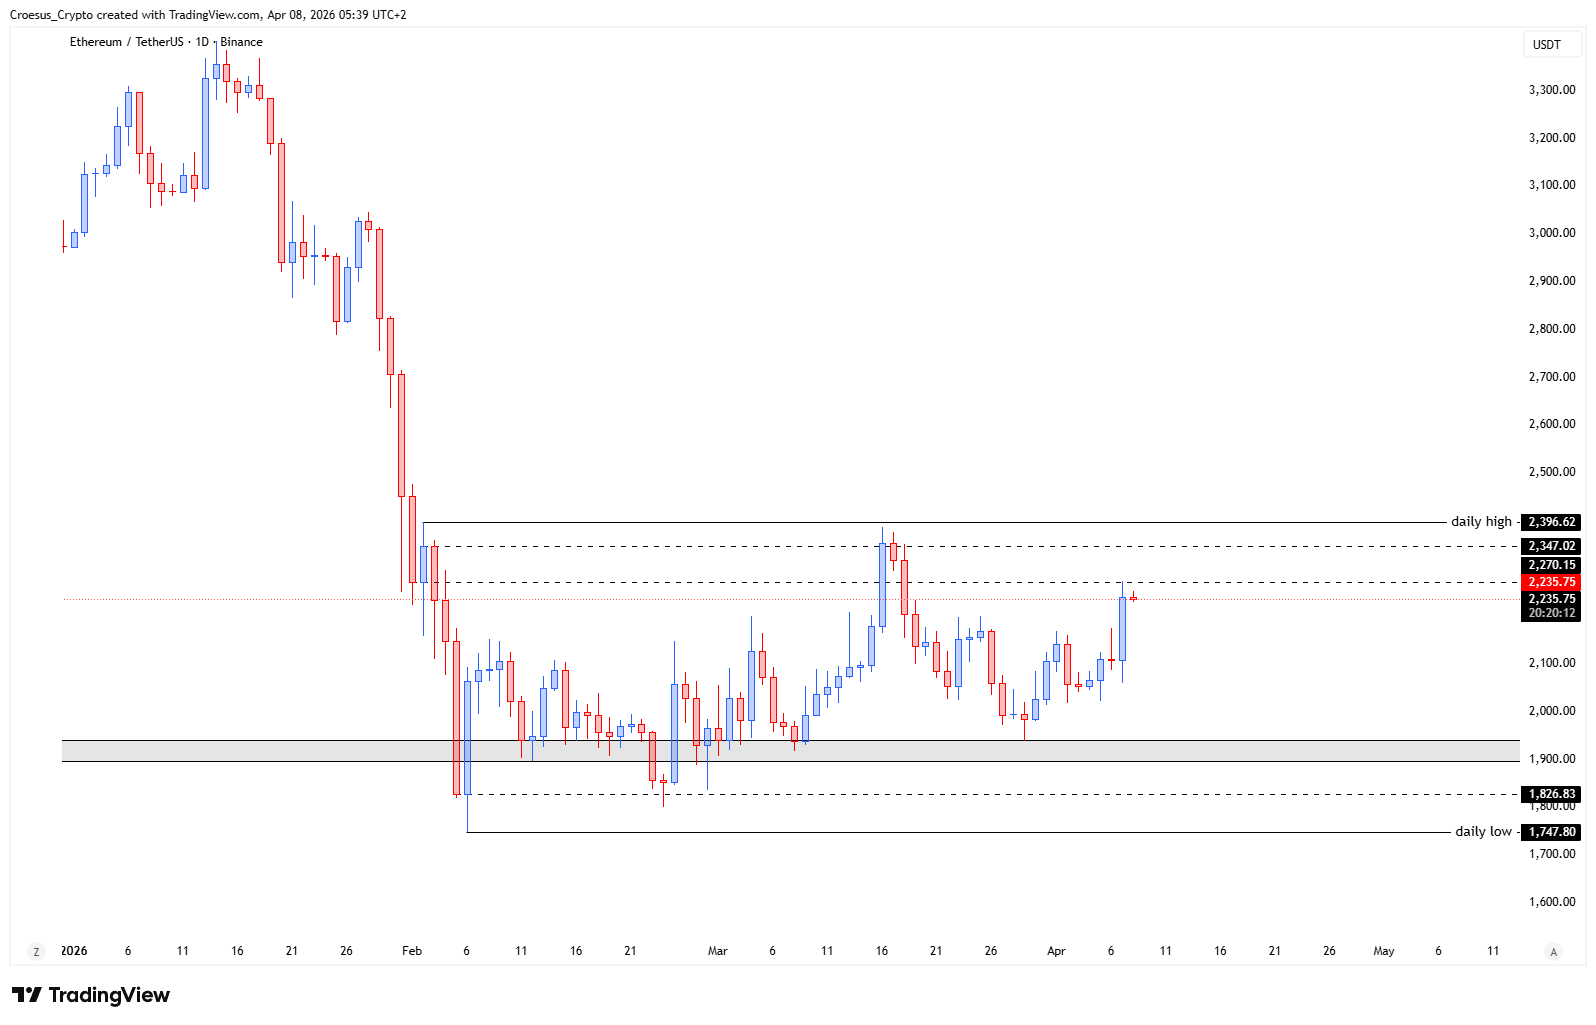
- The ETH price shows us a bullish push but into a key level, at the daily highs
- Price needs to show us its true coulours : do we see a bullish breakout and confirmation past the daily high ? Or do we see a rejection back into the daily range ?
Market Structure Analysis
From a naked trading perspective, the current ETH daily analysis is defined by a test of a prior swing level: the daily high acting as horizontal resistance. The bullish push into this level is constructive in the very short term, but in a broader bearish context it can also represent a corrective retracement into supply rather than a clean trend reversal. Structurally, the key question is whether this move becomes impulsive continuation through the range high (acceptance above resistance), or whether it becomes a liquidity event that wicks above/into the high and then rotates back below it (rejection and re-entry into the range). Until price shows acceptance beyond the daily high, we treat the move as a test of resistance rather than confirmation of a new bullish impulse.
Key Levels and Scenarios
ETH daily analysis remains binary around the range high. A bullish scenario requires a breakout and confirmation past the daily high, followed by holding that level as support resistance flips. A bearish scenario is signaled by rejection at the daily high and a rotation back into the daily range, which keeps the broader bearish structure intact.
- Daily high: key resistance level that must break and hold for bullish continuation
- Range high area: acceptance above this zone signals potential trend transition on the daily timeframe
- Daily range midpoint: pivot area that often decides continuation vs. deeper rotation
- Daily range low: structural support; losing it keeps bearish continuation in play
Trading Implications
Aggressive traders typically focus on confirmation around the daily high (acceptance vs. rejection), while conservative traders often wait for a clear support resistance flip or a clean rejection back inside the range before committing risk. In this environment, patience around the range boundary generally improves risk/reward.
This analysis is for informational purposes only and does not constitute financial advice.