


In this Ethereum daily analysis for December 2025, we focus on the recent break of structure (BOS), the retest around $3,031.44, and why our technical analysis remains cautious until a clearer trend reversal prints. We treat the current move as an early stage attempt at a bullish shift, but not yet a confirmed change of trend.
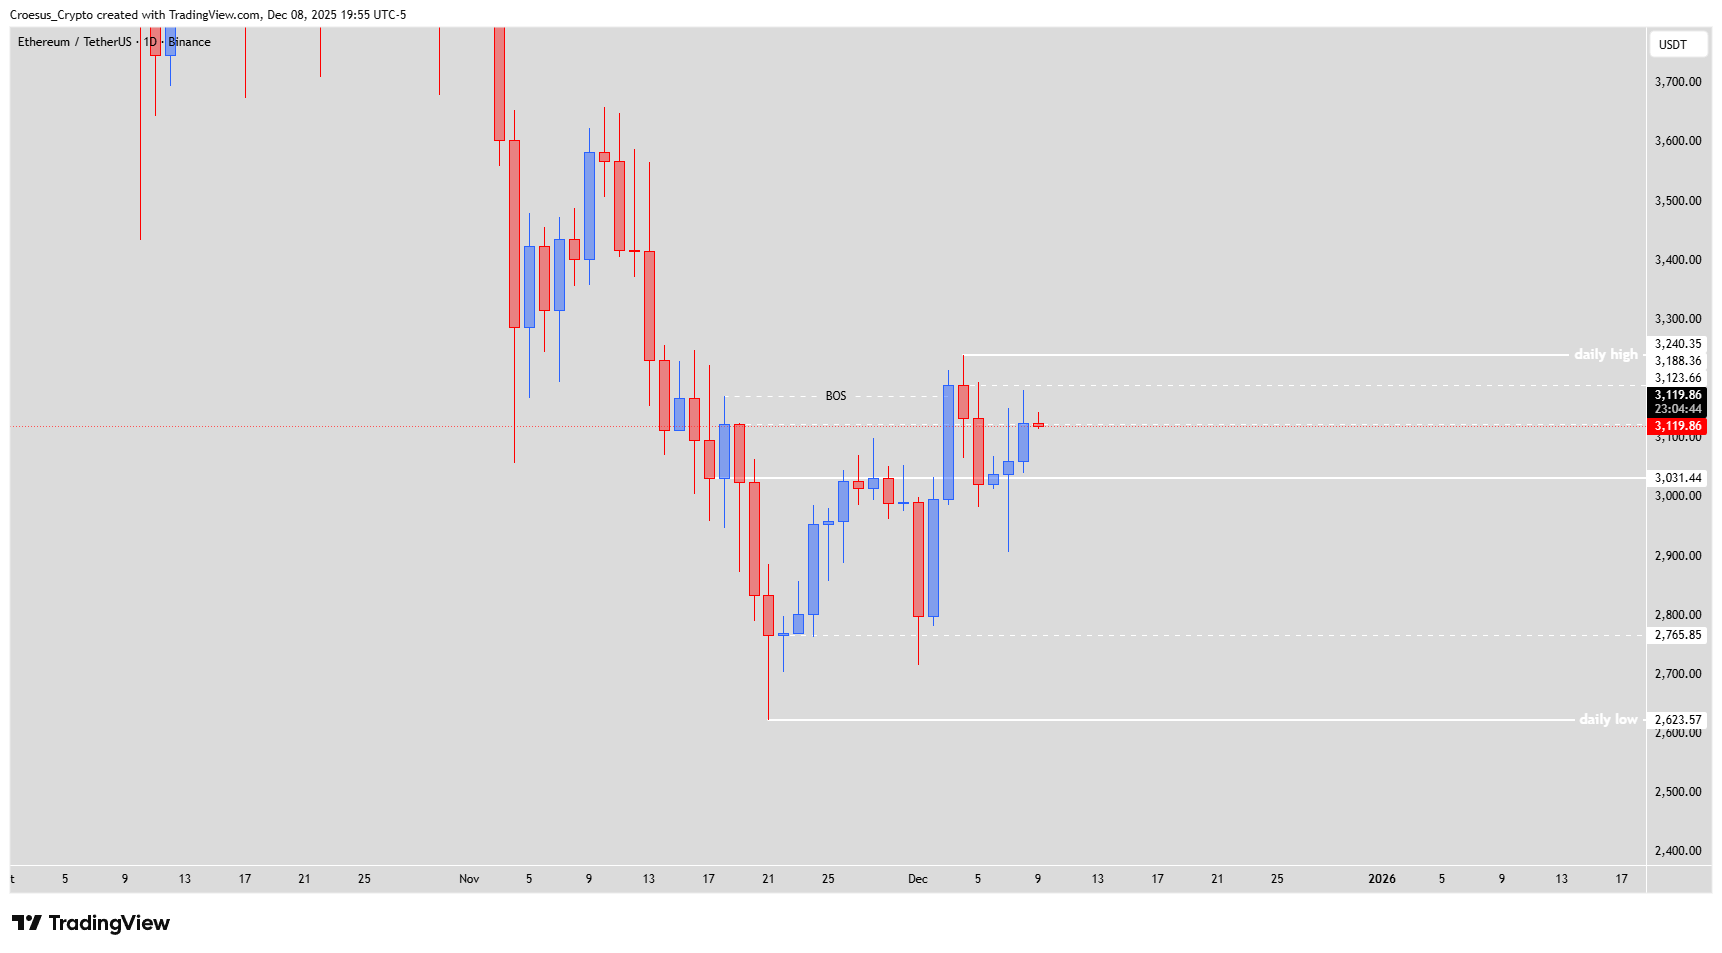
Ethereum daily chart 8 Dec 2025 showing weak break of structure and price retest of the $3,031.44 shoulder level near prior daily high.
Technical Analysis Key Points
- After the break of structure the price retested the $3.031,44 level which could act as the shoulder level.
- But that level was not respected (close slightly below), so we could expect that price will retest this level again in order to respect it then.
- We still need to be careful. The break of structure (BOS) was very weak. The day after price closed above the prior daily high, we saw the price retrace below that level. Therefore this could easily be a fake out, misleading the traders with a long bias. We need to see a second higher high to confirm the switch of trend.
Market Structure Analysis
Our Ethereum daily analysis shows that the BOS to the upside was shallow and immediately questioned by the next candle, which closed back below the prior daily high. That behaviour fits a classic support resistance flip test that fails on first attempt, often used by market makers to lure in premature longs.
The $3,031.44 zone now acts as a potential “shoulder” level: price has already dipped slightly through it, so another cleaner retest and strong reaction would be needed to validate it as support.
Until we see a second higher high above the BOS high, we cannot confidently say the bearish structure has switched; this could still be a fake-out inside a larger downtrend.
Fibonacci tools can be added later by traders, but the key message from this technical analysis is structural, not fib-based.
Key Levels and Scenarios
Key levels to watch:
$3,031.44 – Potential shoulder and key support to validate on a fresh retest.
Prior daily high – The level briefly broken on BOS; needs reclaiming and holding to negate the fake-out risk.
Recent BOS high – A break above this swing is required as a second higher high for real trend confirmation.
Current range low – Loss of this area would show the BOS failed and reassert bearish control.
Trading Implications
Until Ethereum confirms with a second higher high and a respected retest of $3,031.44, we treat this as a fragile setup, keeping risk tight and position sizing modest while respecting both support resistance boundaries.
This content is for educational purposes only and is not financial advice or a recommendation to buy or sell any asset.