


ETH Marketcap / Ethereum
ETH daily analysis 08/04/2026. Ethereum is currently printing a technically constructive bounce inside a broader bearish context, with price reacting around prior structure and key support resistance zones as the market digests the latest impulsive leg.
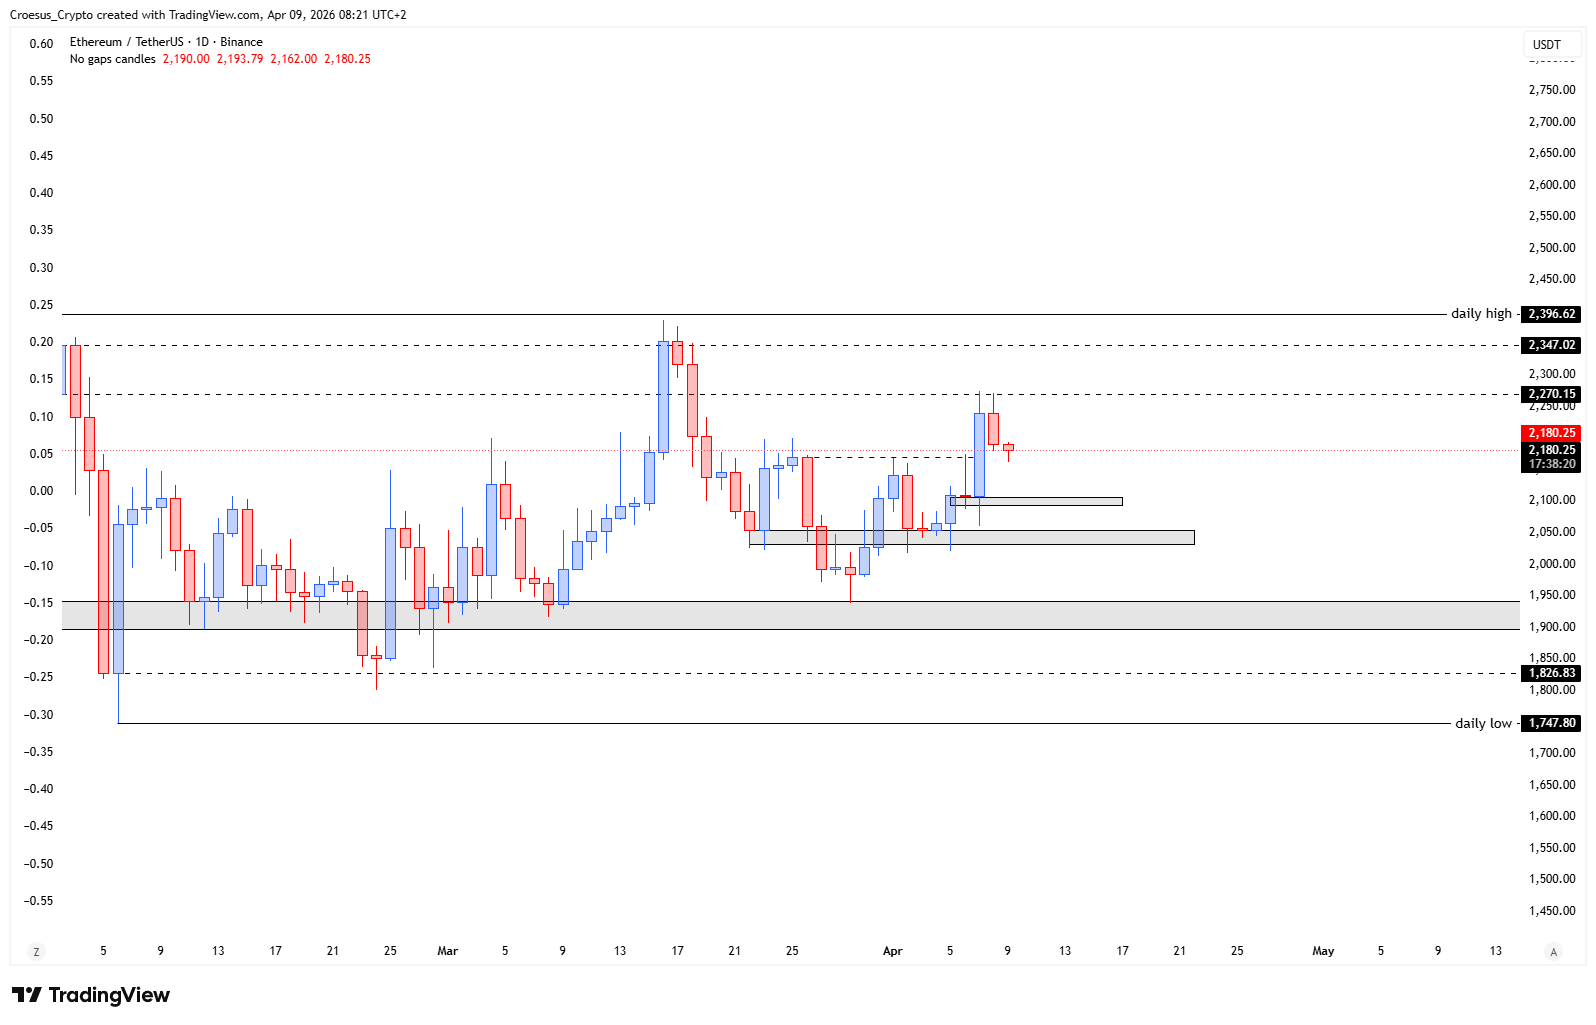
- The ETH price shows us that it is leading the way. ETH has already formed its inverse head and shoulder, went back up to the neckline and retested the shoulder level, followed by a bullish push up.
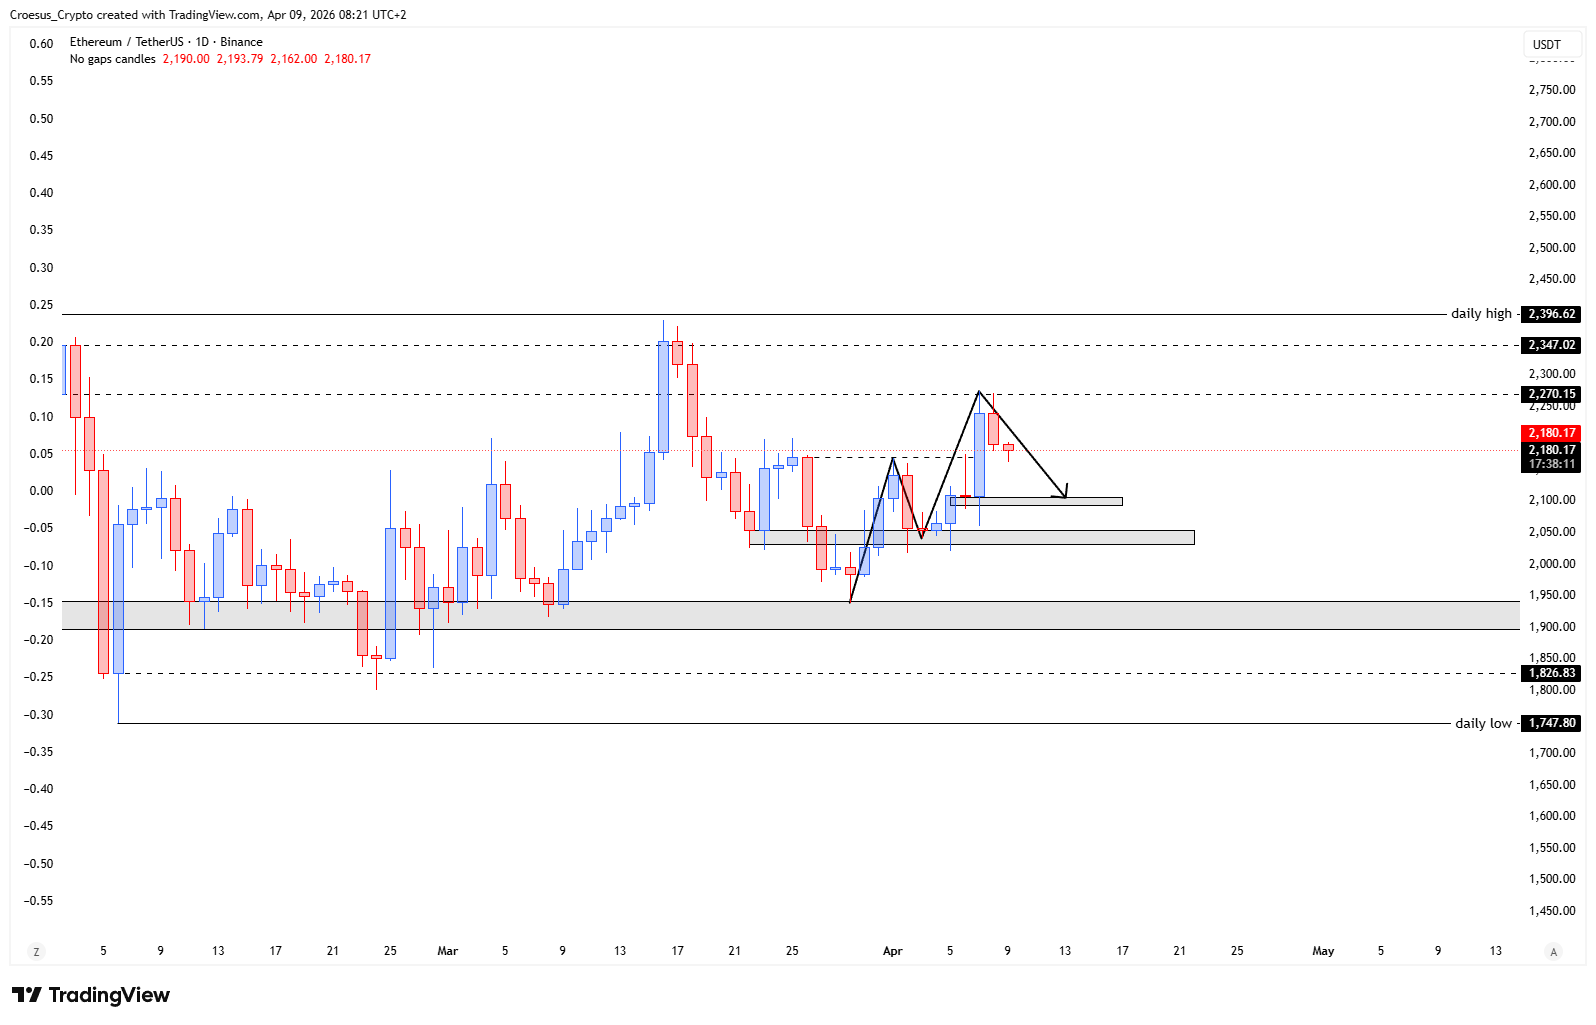
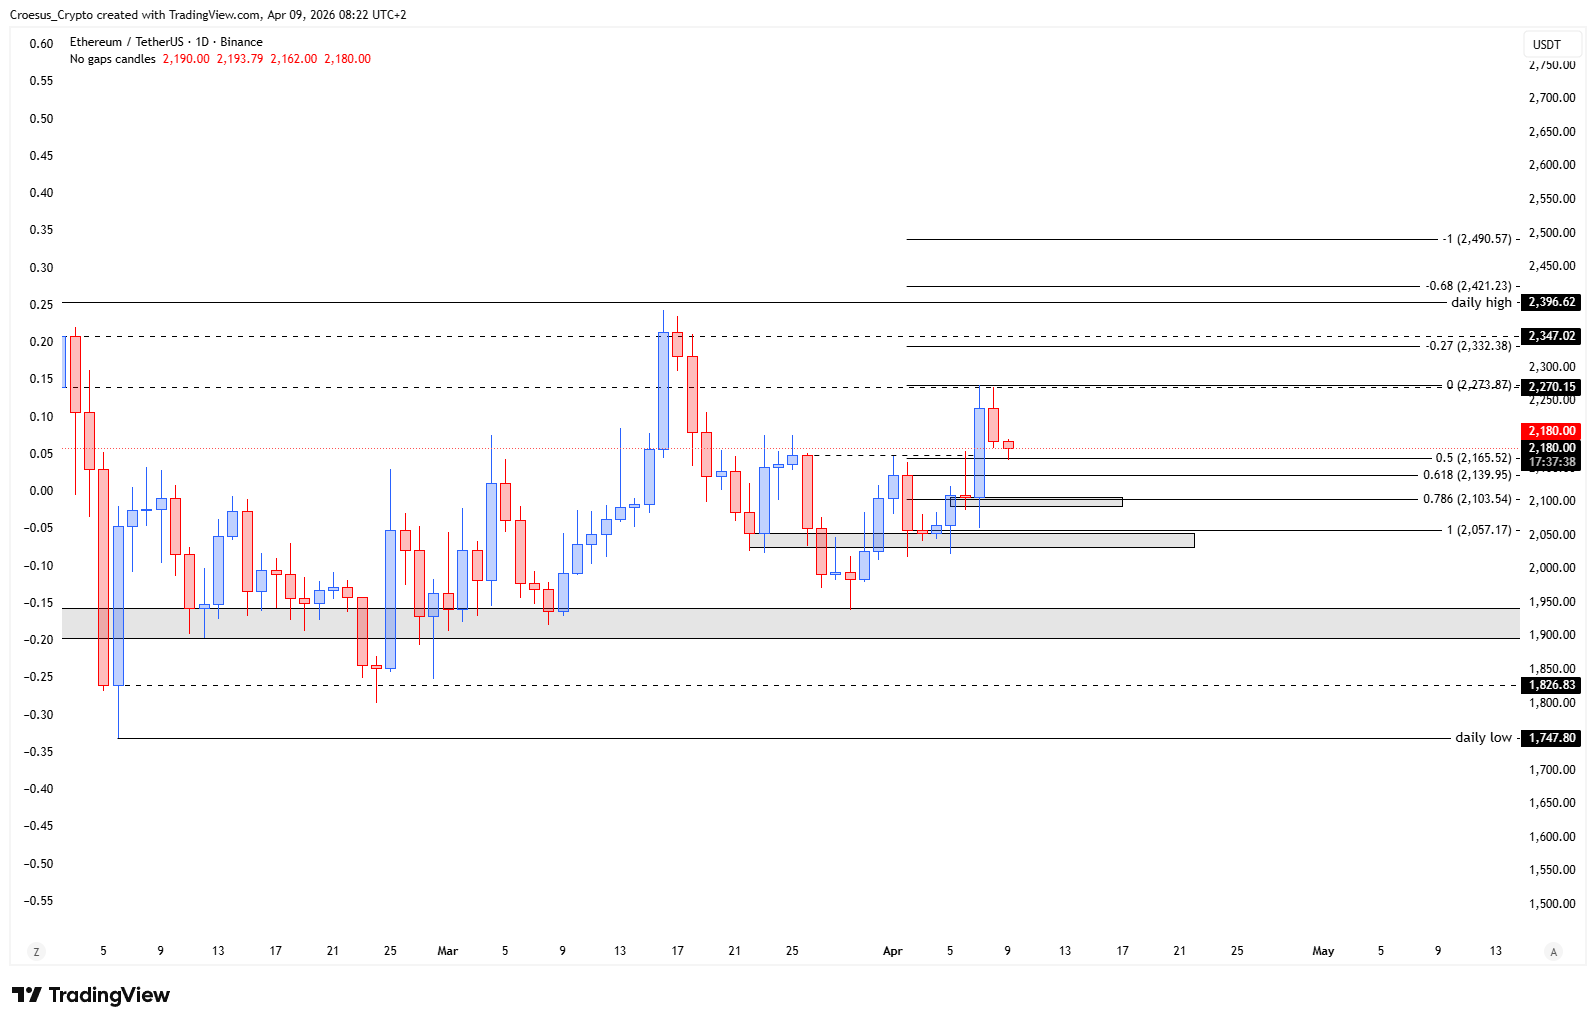
- At this moment we can see relief of the impulsive move up. As the shoulderlevel has already been revisited, we might not drop back to that level again. That is why we have marked the intermediate level around 2.100 $ as potential daily entry zone. If we take the fibonacci retracement of the last leg up, we can see the 0.786 aligning with that level (keeping a full retracement towards the shoulderlevel open as a possible daily entry zone)
Market Structure Analysis
From a naked trading perspective, the inverse head and shoulders is the key structural development: it signals that demand is stepping in after a sequence of lower lows, and the neckline becomes the first major decision area. The push back to the neckline and the subsequent retest of the shoulder level is important because it shows the market converting prior resistance into support, creating a cleaner base for continuation attempts.
However, our ETH daily analysis still treats this as a corrective sequence until price can hold acceptance above the neckline with follow-through, because the higher-timeframe bias provided is bearish. The current “relief” is consistent with a corrective pullback after an impulsive move up, where the market often retraces into a Fibonacci confluence zone before choosing continuation versus failure.
Key Levels and Scenarios
In this ETH daily analysis, the constructive scenario is price holding above the shoulder structure and using the $2.100 area as support, with the 0.786 Fibonacci confluence acting as a technical analysis trigger zone. The bearish continuation scenario remains open if the retracement deepens and invalidates the reclaimed structure, turning the shoulder level back into resistance.
- $2.100 as the intermediate support resistance zone highlighted as a potential daily entry area
- 0.786 Fibonacci retracement of the last leg up, aligning with the $2.100 area
- Shoulder level as the deeper retracement/invalidation area if price fails to hold the intermediate level
- Neckline as the key decision level for acceptance versus rejection
Trading Implications
Given the bearish trend label, risk management matters: aggressive participants typically focus on reactions at the intermediate confluence, while conservative participants often wait for confirmation around the neckline and a clear higher-high structure. Until the market proves continuation, this remains a corrective environment where failed breakouts and deeper pullbacks are still plausible.
This analysis is for informational purposes only and does not constitute financial advice.