


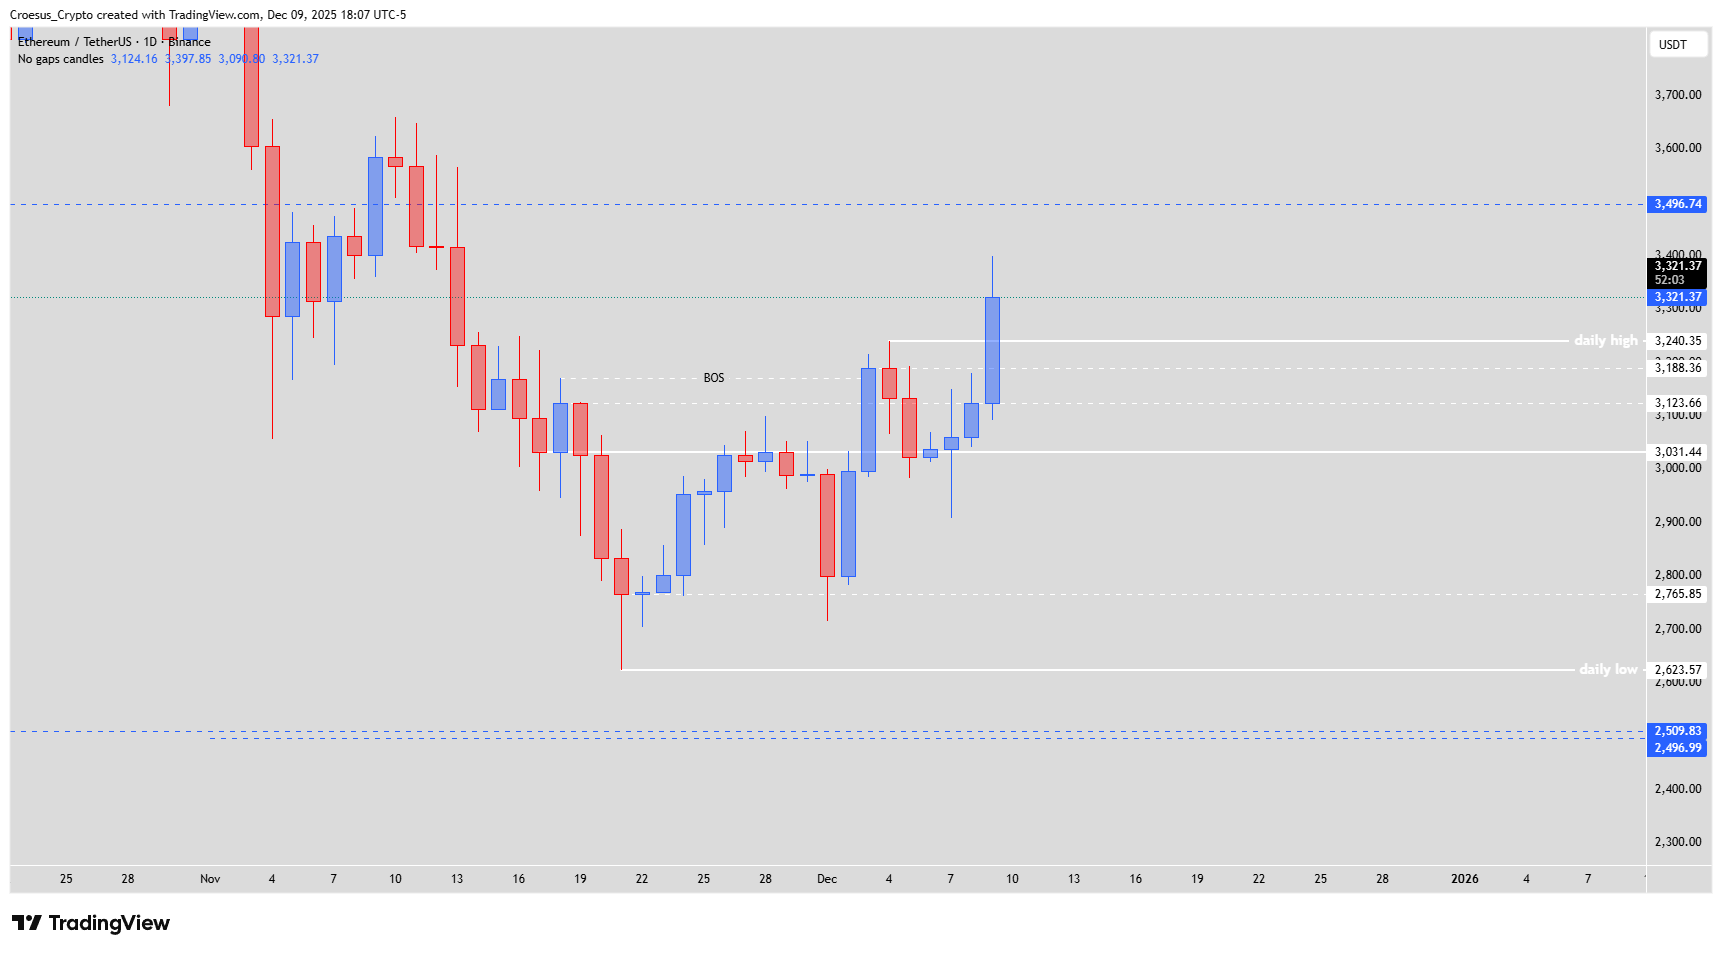
In our Ethereum daily analysis for 09 December 2025, ETH finally chose a clear bullish direction, breaking the daily high again and printing a temporary new higher high. With this second higher high, we can now speak of a clear switch in trend on the daily timeframe, from bearish to bullish, within the current range structure. Short term, however, our technical analysis suggests we should be prepared for a corrective move after the strong impulse.
ETH daily chart 9 Dec 2025 with break of structure, new higher high and range between daily high and daily low.
Technical Analysis Key Points
- Today the price chose a clear bullish direction, breaking again the daily high, printing a (temporary) new higher high. At this moment we can speak of a switch of trend (second higher high)
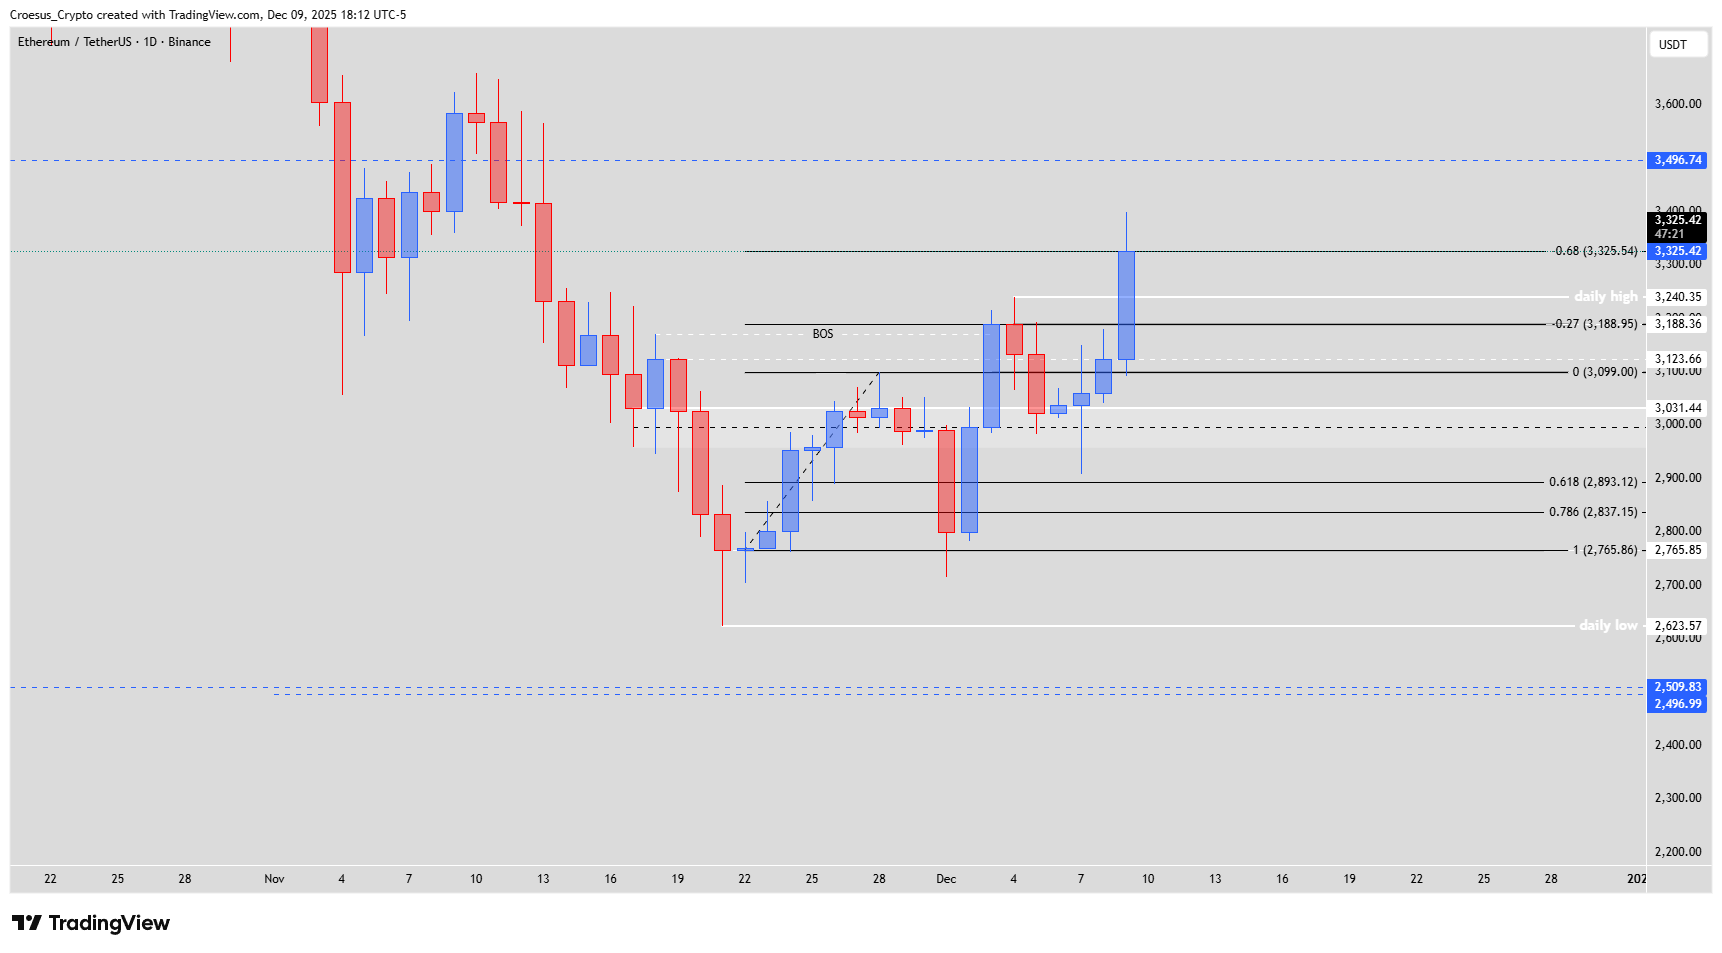
- But we can expect a retrace. The first leg up touched the -0.27 level before correcting, now we see the -0.68 level being touched.
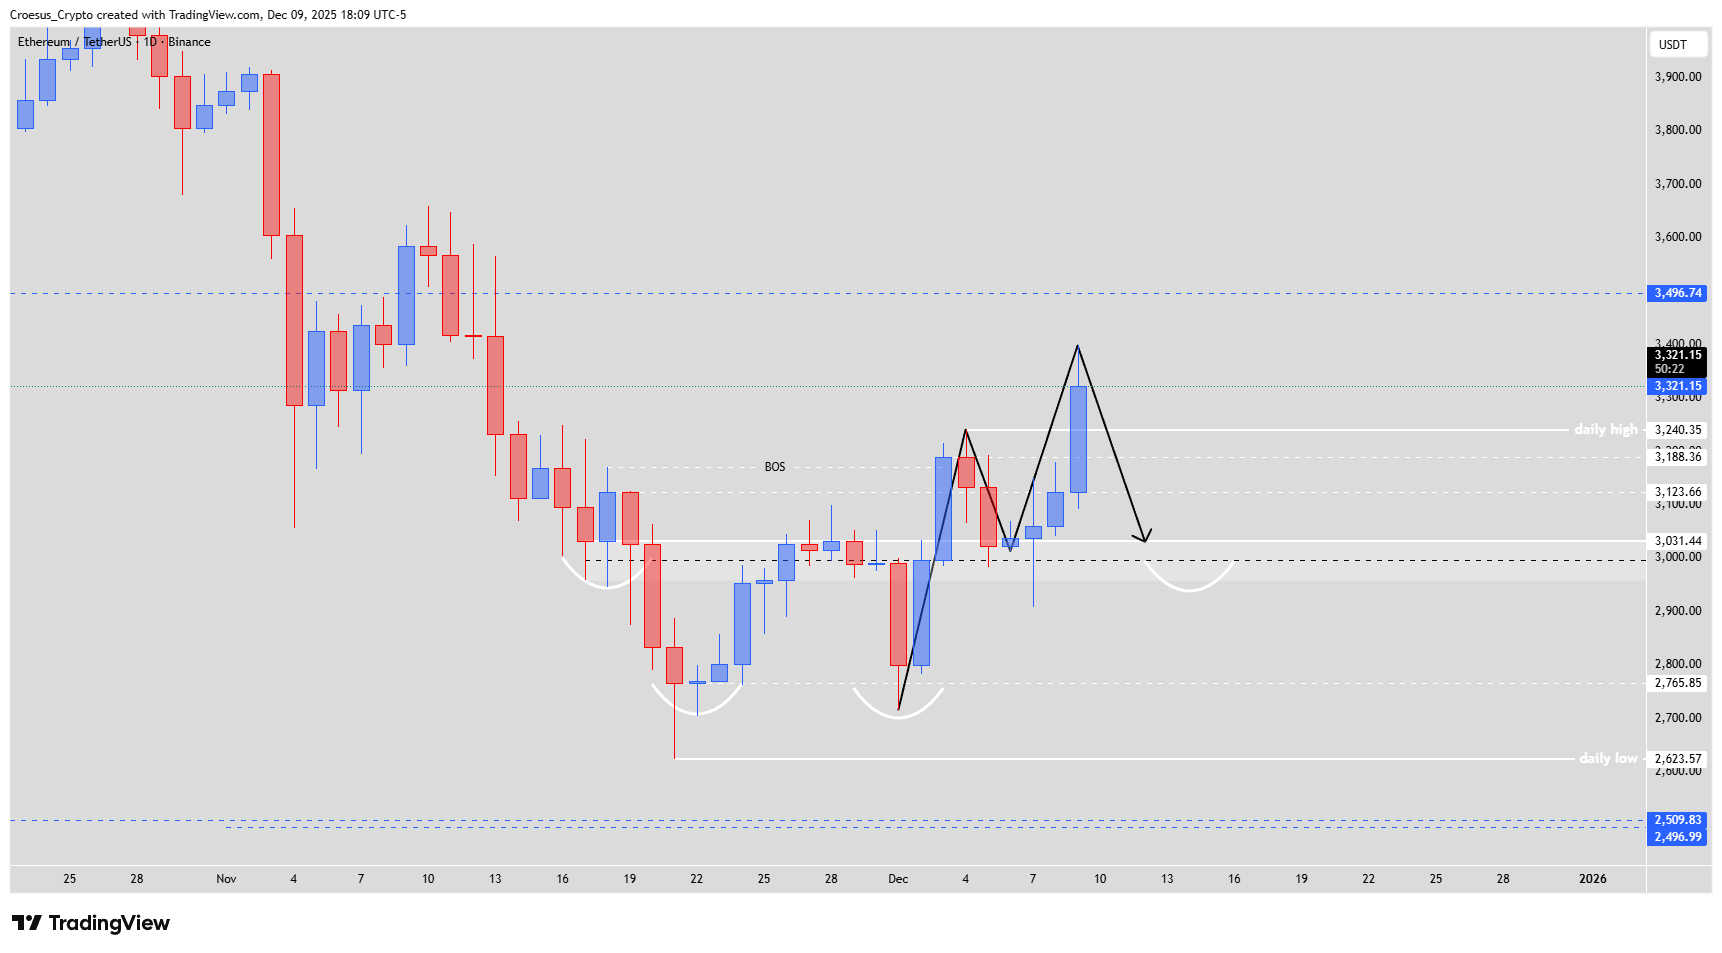
- Where do we look for the corrective level ? At this moment we see a pattern in a pattern. On the one hand we can see a bullish M being printed. If we see a fib 100% retracement of the last bullish leg, we land on or around the $3.031 $. This level is also the shoulderlevel of the inverse head and shoulder pattern (the second pattern).
- Retesting this level would mean that we are respecting the $3.000 level, a critical psychological level.
Market Structure Analysis
From a market-structure perspective, ETH has confirmed a break of structure to the upside by taking the daily high and forming a second higher high. The first impulsive leg stalled at the -0.27 Fibonacci extension before retracing; the current leg has now tagged the deeper -0.68 extension, which often precedes corrective price action in classical Fibonacci-based technical analysis.
We are now watching a “pattern in a pattern”: a bullish M structure nested inside a larger inverse head and shoulders. A full 100% Fibonacci retracement of the last bullish leg brings price back toward $3,031, which aligns with the inverse H&S shoulder level and forms a clean support resistance zone. A controlled pullback into $3,031 that holds above the $3,000 psychological handle would confirm that buyers are defending this key area and could set up the next continuation leg higher.
Key Levels and Scenarios
Bullish scenario: A healthy retrace into the $3,031 shoulder, with daily closes holding above $3,000, would keep the bullish M and inverse H&S structures intact and offer a potential springboard for another push to new highs beyond the recent -0.68 extension. Failure to hold that zone would weaken the new uptrend and open room for a deeper test of the broader daily low.
Key levels to monitor:
Recent daily high area: new higher high and reference point for continuation.
-0.68 Fibonacci extension zone: current exhaustion area for the latest impulsive leg.
$3,031: 100% fib retrace target and inverse H&S shoulder; primary corrective support.
$3,000: critical psychological level and must-hold support for bulls.
Daily low region: deeper downside liquidity if $3,000 fails.
Trading Implications
With trend now bullish but an imminent retrace likely, traders may look for long opportunities only on evidence of support forming between $3,031 and $3,000, keeping stops below the shoulder and sizing positions conservatively until the retrace completes.
This content is for educational purposes only and is not financial advice or a recommendation to buy or sell any asset.