

ETH Marketcap / Ethereum
ETH daily analysis 09 February 2026. Ethereum remains bearish, and current price action is a counter-trend bounce that is now pressing into a major resistance area defined by a prior weekly support level that flipped.
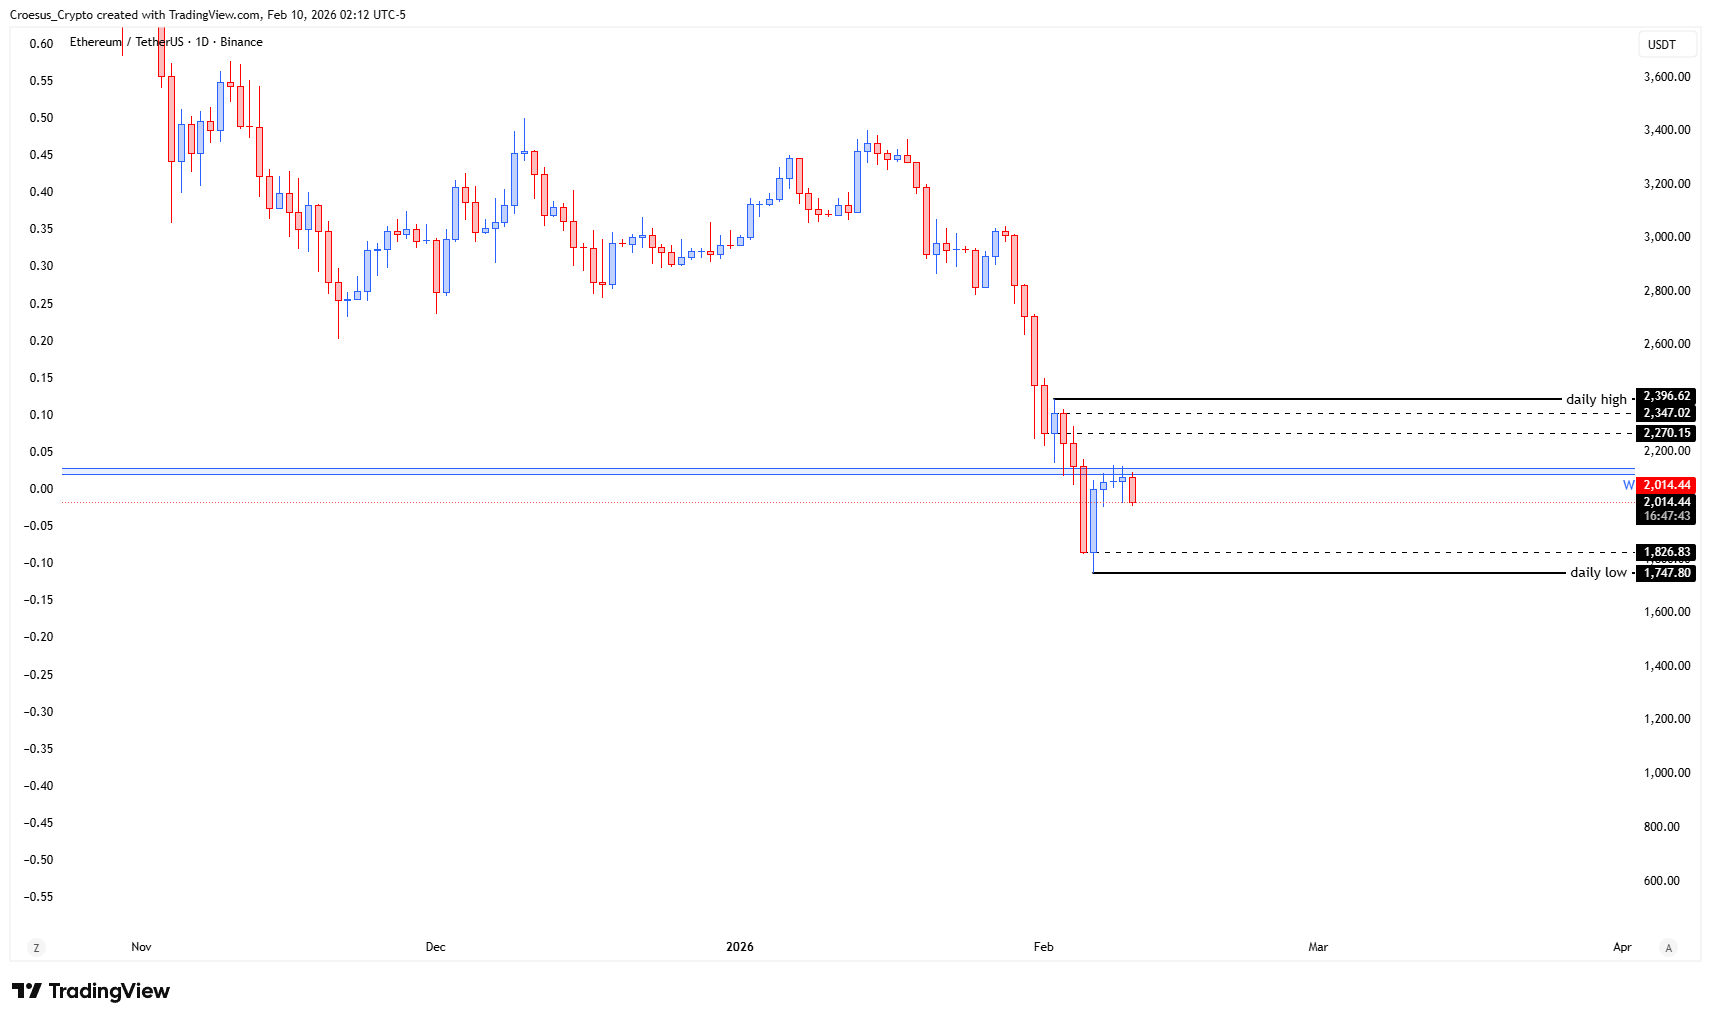
- ETH shows us a bullish correction capped at a broken weekly support flipped into a resistance zone
- This could play out in two ways : either an ABC-correction, expecting a larger bullish corrective move or a bearish W (as the fib 0.618 retracement level has been activated).
Market Structure Analysis
In this ETH daily analysis, the key read is that the upside leg is corrective until proven otherwise, because price is reacting into a “support resistance” flip rather than cleanly breaking and holding above it. Even on a daily chart, a broken weekly support zone tends to behave as a higher-quality supply area: it is where prior buyers got trapped on the breakdown, and where sellers often defend on the retest.
Structurally, this creates a decision point—either the market regains acceptance above that zone (shifting short-term structure), or it rejects and resumes the dominant bearish path. The “fib 0.618 retracement level” being activated adds Fibonacci confluence to the idea that the bounce has reached a common corrective depth where reactions frequently occur, increasing the probability of either a pause/rotation or a final push within an ABC-style correction before continuation lower.
Key Levels and Scenarios
ETH daily analysis scenarios are defined by how price behaves at the flipped weekly zone and around the 0.618 retracement context. A bullish corrective outcome requires acceptance above the resistance flip and the ability to build higher daily swing structure. The bearish continuation case strengthens if price gets rejected from the flipped zone and rotates lower, aligning with the bearish “W” pathway described in the observation.
- Broken weekly support flipped into a resistance zone (acceptance above vs rejection below is the main trigger)
- 0.618 Fibonacci retracement level (confluence area for corrective exhaustion or extension)
This analysis is for informational purposes only and does not constitute financial advice.