


ETH Marketcap / Ethereum
ETH Daily analysis 09 February 2026. Ethereum is trading in a bearish context while printing a short-term bullish corrective leg that is currently stalling into a clear support resistance flip, keeping downside risk active despite the bounce.
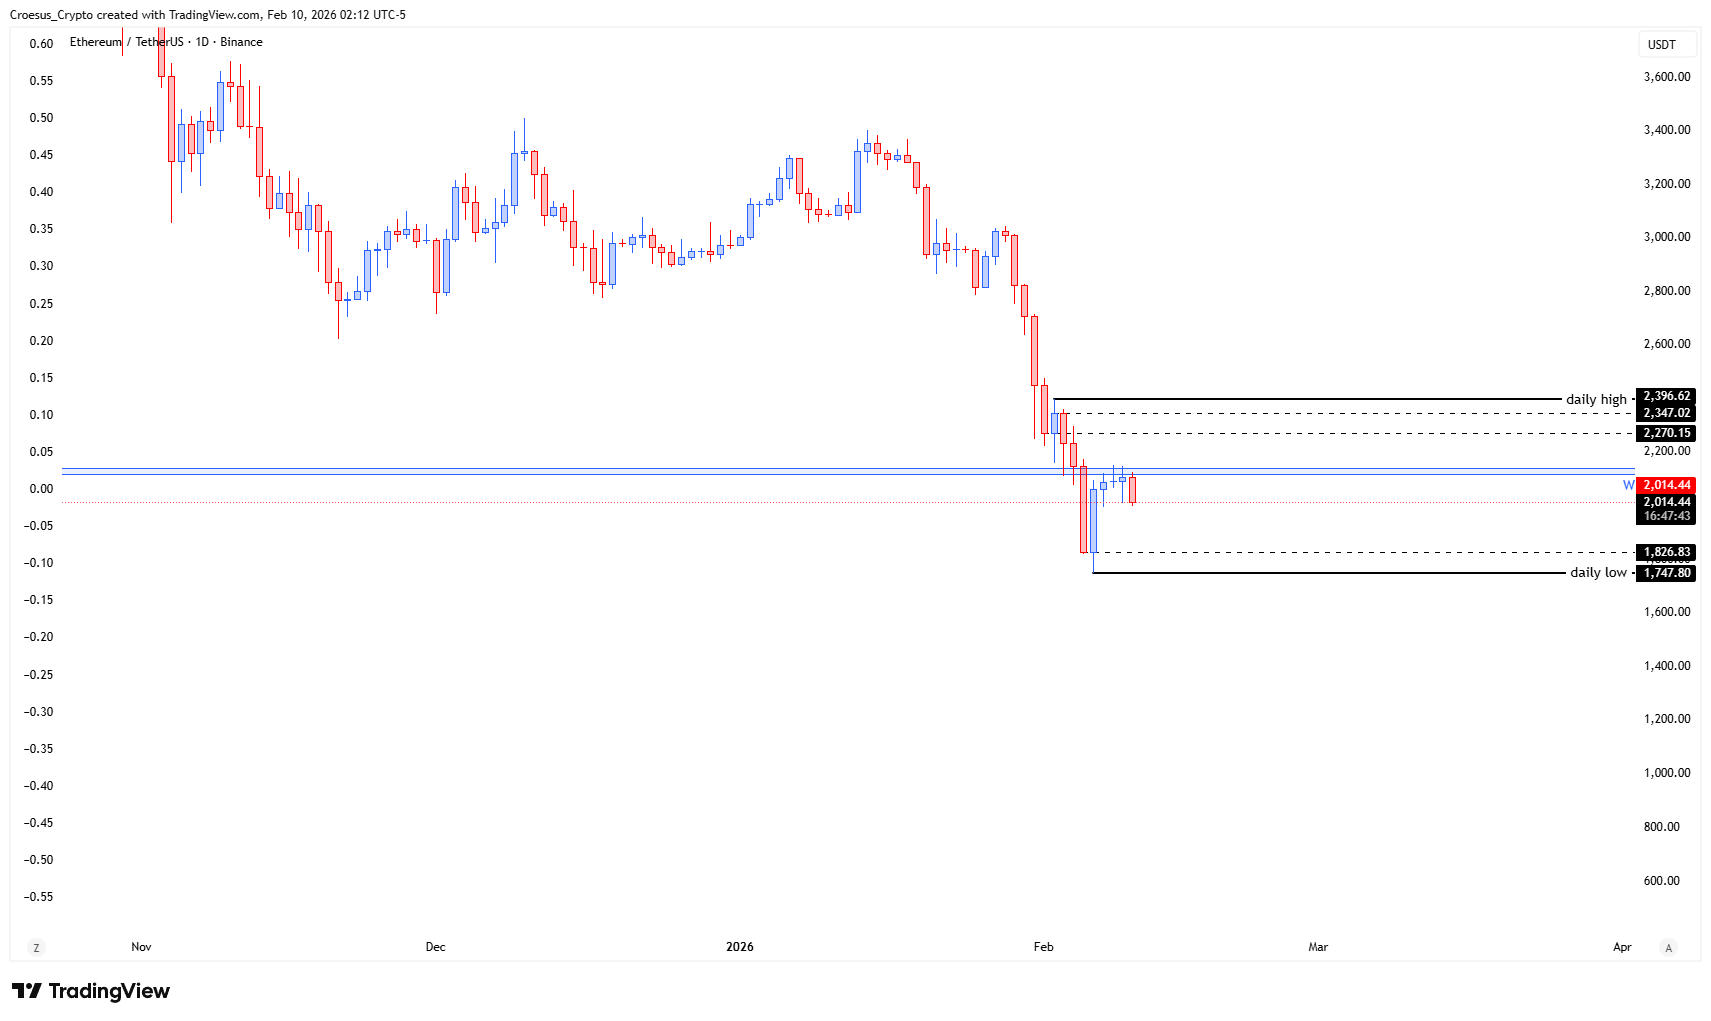
- The price made a bullish corrective move. This move was capped at a broken support that flips now to resistance
- This could be the start of a larger ABC correction, expecting the price to retest the low again before seeing a larger bullish correction towards the daily high
- Or this could simply be a bearish W playing out as the fib 0.618 retracement level has been activated.
Market Structure Analysis
Our ETH daily analysis reads the current push higher as corrective, not impulsive, because it stalls exactly where prior horizontal support is now acting as resistance.
Structurally, this is a typical bearish sequence: a breakdown creates a new ceiling, and the first retest often becomes the decision point for continuation. From here, the two mapped paths both keep the “low retest” as the key near-term expectation.
In the ABC framework, the current bounce functions as a counter-trend leg that can still be followed by another sweep into the prior swing low before a more meaningful corrective recovery toward the daily high. Alternatively, the mention of a bearish W combined with an “activated” 0.618 Fibonacci retracement keeps focus on a sell-side response from that retracement zone, aligning with continuation behavior after a corrective rebound into resistance.
Key Levels and Scenarios
For bearish continuation, ETH needs to keep rejecting the flipped resistance zone and follow through with a break back toward the prior low. A bullish alternative only starts to open if price can reclaim the broken-support-turned-resistance area and hold above it, shifting the corrective rally into a more constructive recovery.
- Broken support that flips now to resistance (primary rejection / decision zone)
- The low (key level to retest in both outlined scenarios)
- The fib 0.618 retracement level (active reaction area within the current correction)
- The daily high (upside objective if a larger bullish correction develops)
Trading Implications
With trend still bearish, aggressive participants typically treat rallies into resistance and Fibonacci reaction zones as areas where volatility can expand quickly, while conservative participants usually wait for confirmation via a clear reclaim of resistance or a clean breakdown toward the low retest. Until structure improves, risk skews toward rejection-driven moves rather than sustained upside.
This analysis is for informational purposes only and does not constitute financial advice.