


ETH Marketcap / Ethereum
ETH daily analysis 09/04/2026. Ethereum is currently trading in a bearish context after a failed retest, keeping the market in a corrective posture while traders watch whether the current structure resolves into a deeper pullback or a continuation setup.
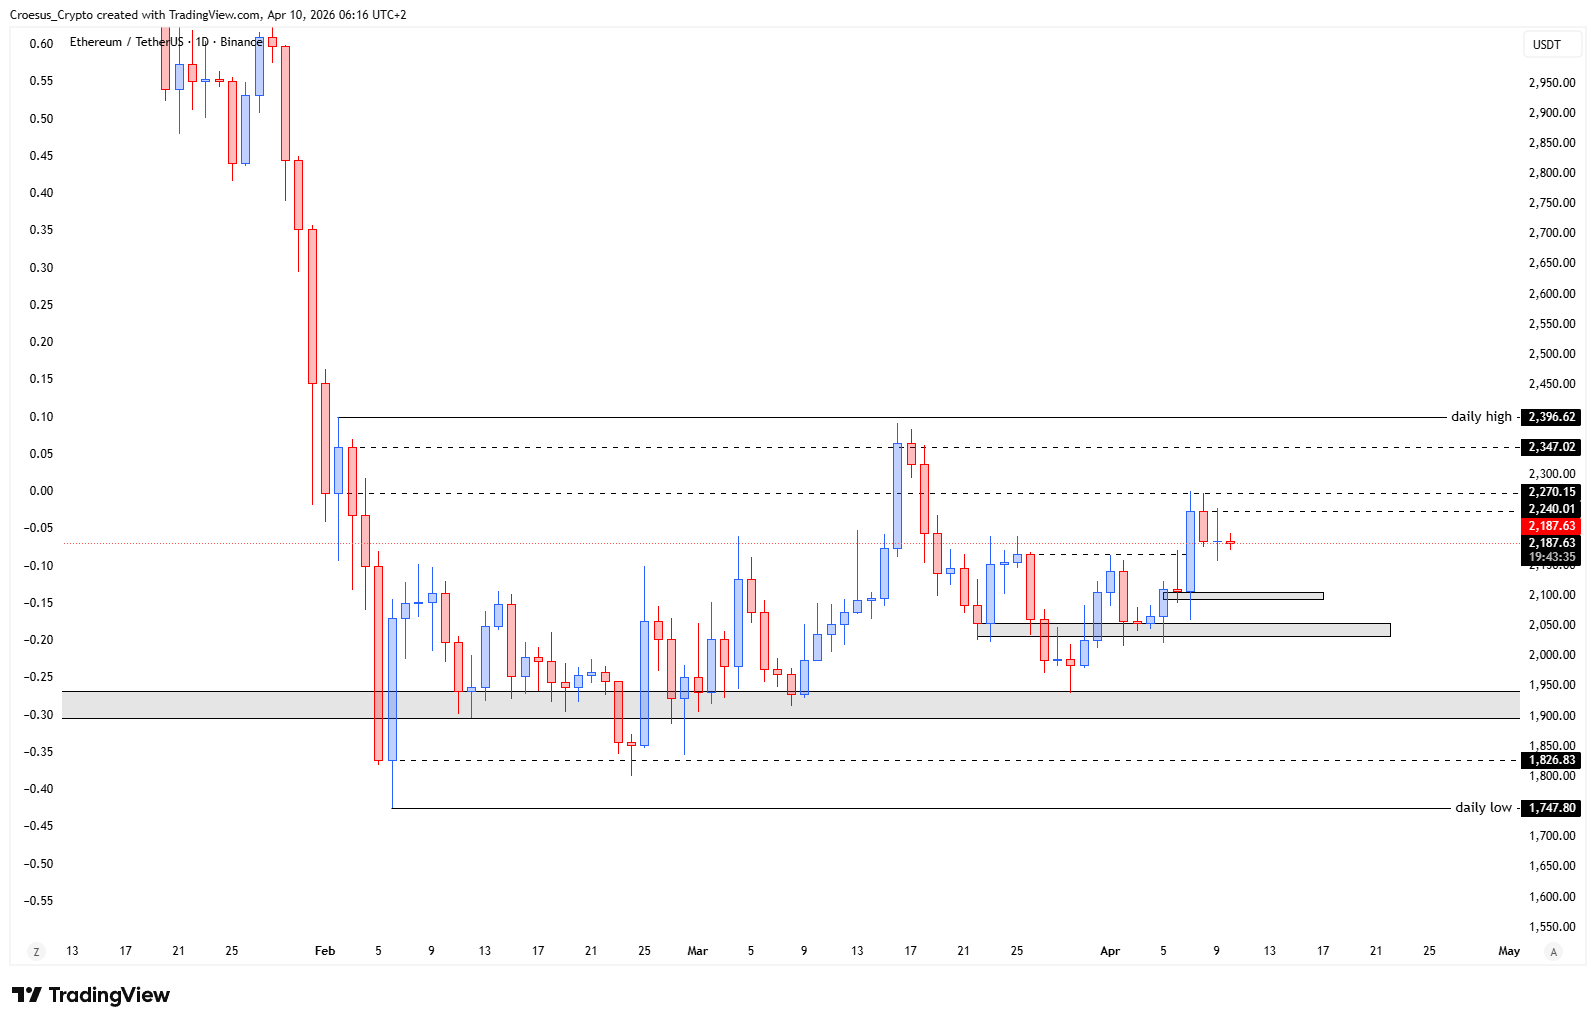
- The ETH price shows us that the local high was retested but rejected.
- This keeps the possibility of an ABC correction valid, with the push down being the A and the retest of the high being the B. This would bring the C back to the open of the bullish candle.
- If this would play out, this would frame in a bullish continuation after printing the C
Market Structure Analysis
From a market structure perspective, the rejection after retesting the local high is the key piece of information: price attempted to reclaim prior supply, failed, and is now vulnerable to continuation lower within a corrective sequence.
Our ETH daily analysis keeps the ABC framework on the table, where the initial sell-off acts as the A-leg, the retest/rejection acts as the B-leg, and the market potentially completes the structure with a C-leg into a deeper support zone. The reference to the open of the bullish candle functions as a clean horizontal support/resistance concept in naked trading terms: it is a prior demand reaction point that often becomes a magnet during corrective moves.
Structurally, a clean C completion followed by bullish acceptance would be the condition that shifts the conversation from “bearish correction” to “bullish continuation attempt,” rather than assuming a reversal prematurely.
Key Levels and Scenarios
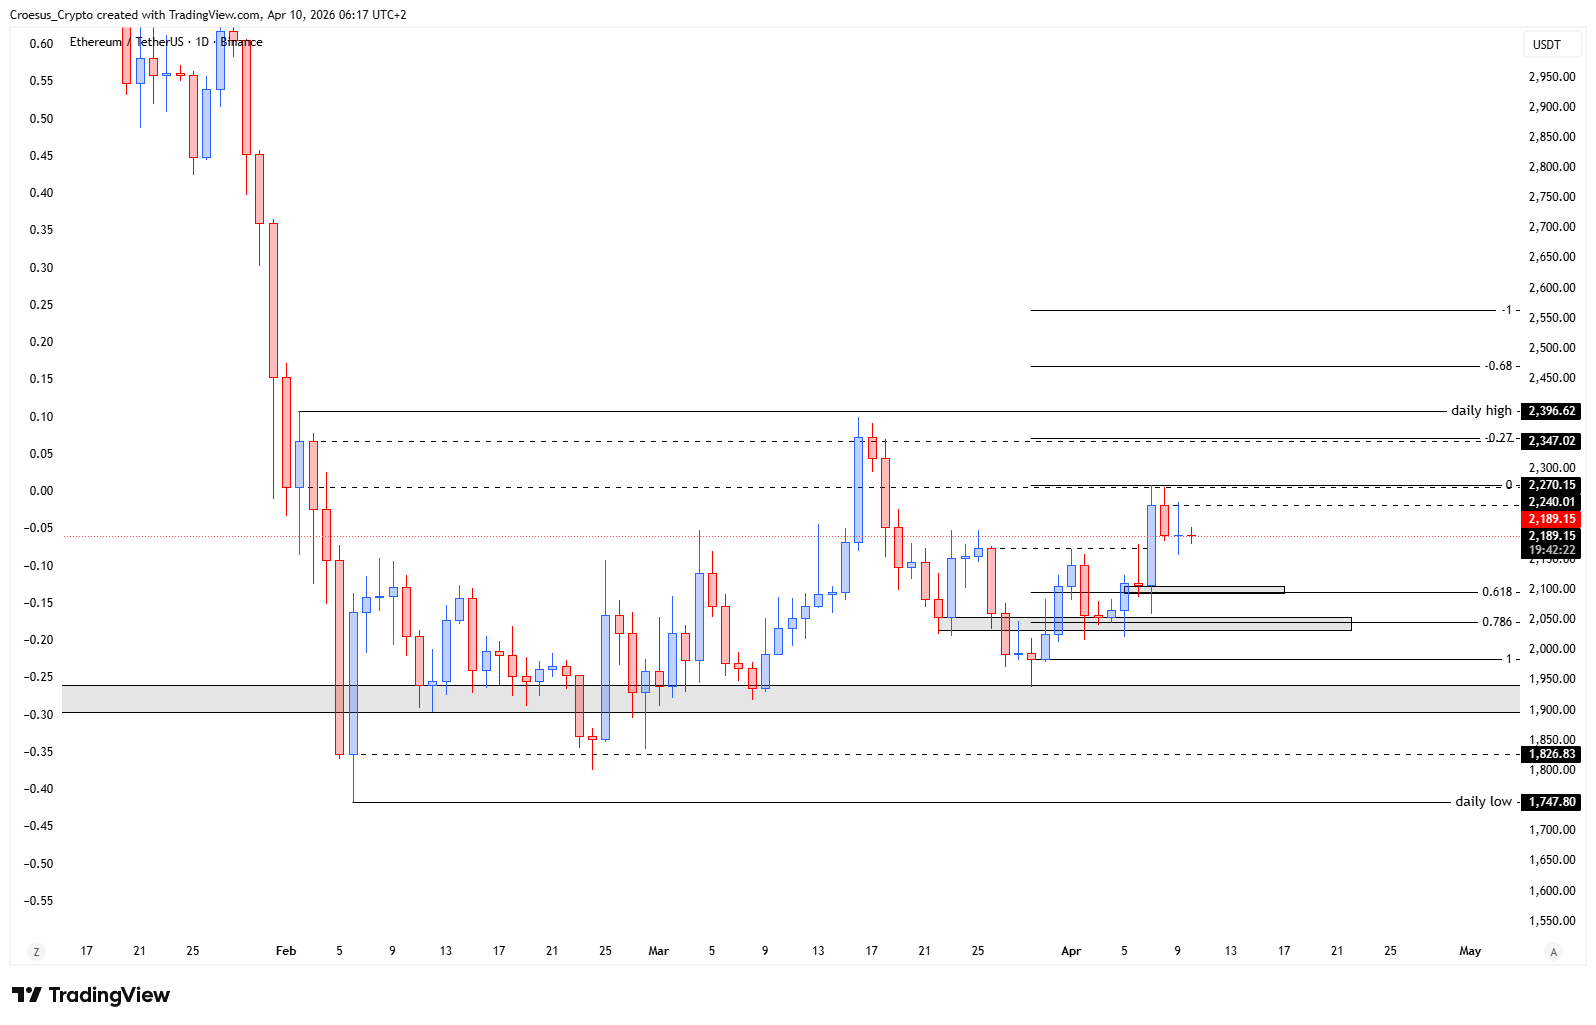
ETH daily analysis remains bearish unless price can reclaim the rejected local high with strength. A bearish continuation scenario plays out if price keeps respecting that high as resistance and drives into the “C” area. A constructive scenario appears only if the C-leg completes and ETH then prints a clear shift in structure from that support region.
- Local high (retest/rejection zone): key resistance that defines the bearish bias
- The open of the bullish candle: the structural downside objective if the ABC correction completes
- The A-leg low: a breakdown below it would confirm continuation pressure inside the correction
- Post-C reaction zone: buyers need to defend and reclaim structure to frame continuation upside
Trading Implications
In this context, aggressive participants typically focus on confirmation around resistance and on signs of exhaustion into the C-leg, while conservative participants usually wait for a clear break of structure back to the upside after the correction completes. Risk is elevated while price is still inside the corrective path and below the rejected high.
This analysis is for informational purposes only and does not constitute financial advice.