


ETH Marketcap / Ethereum
Our Ethereum daily analysis for 11 February 2026 focuses on the current corrective structure following the sharp sell-off from recent highs. ETH is trading below a key weekly level that previously acted as support and has now flipped to resistance, keeping the higher timeframe structure clearly bearish despite the potential for a short-lived relief bounce. This Ethereum timeframe analysis highlights the binary path: corrective recovery versus renewed downside continuation.
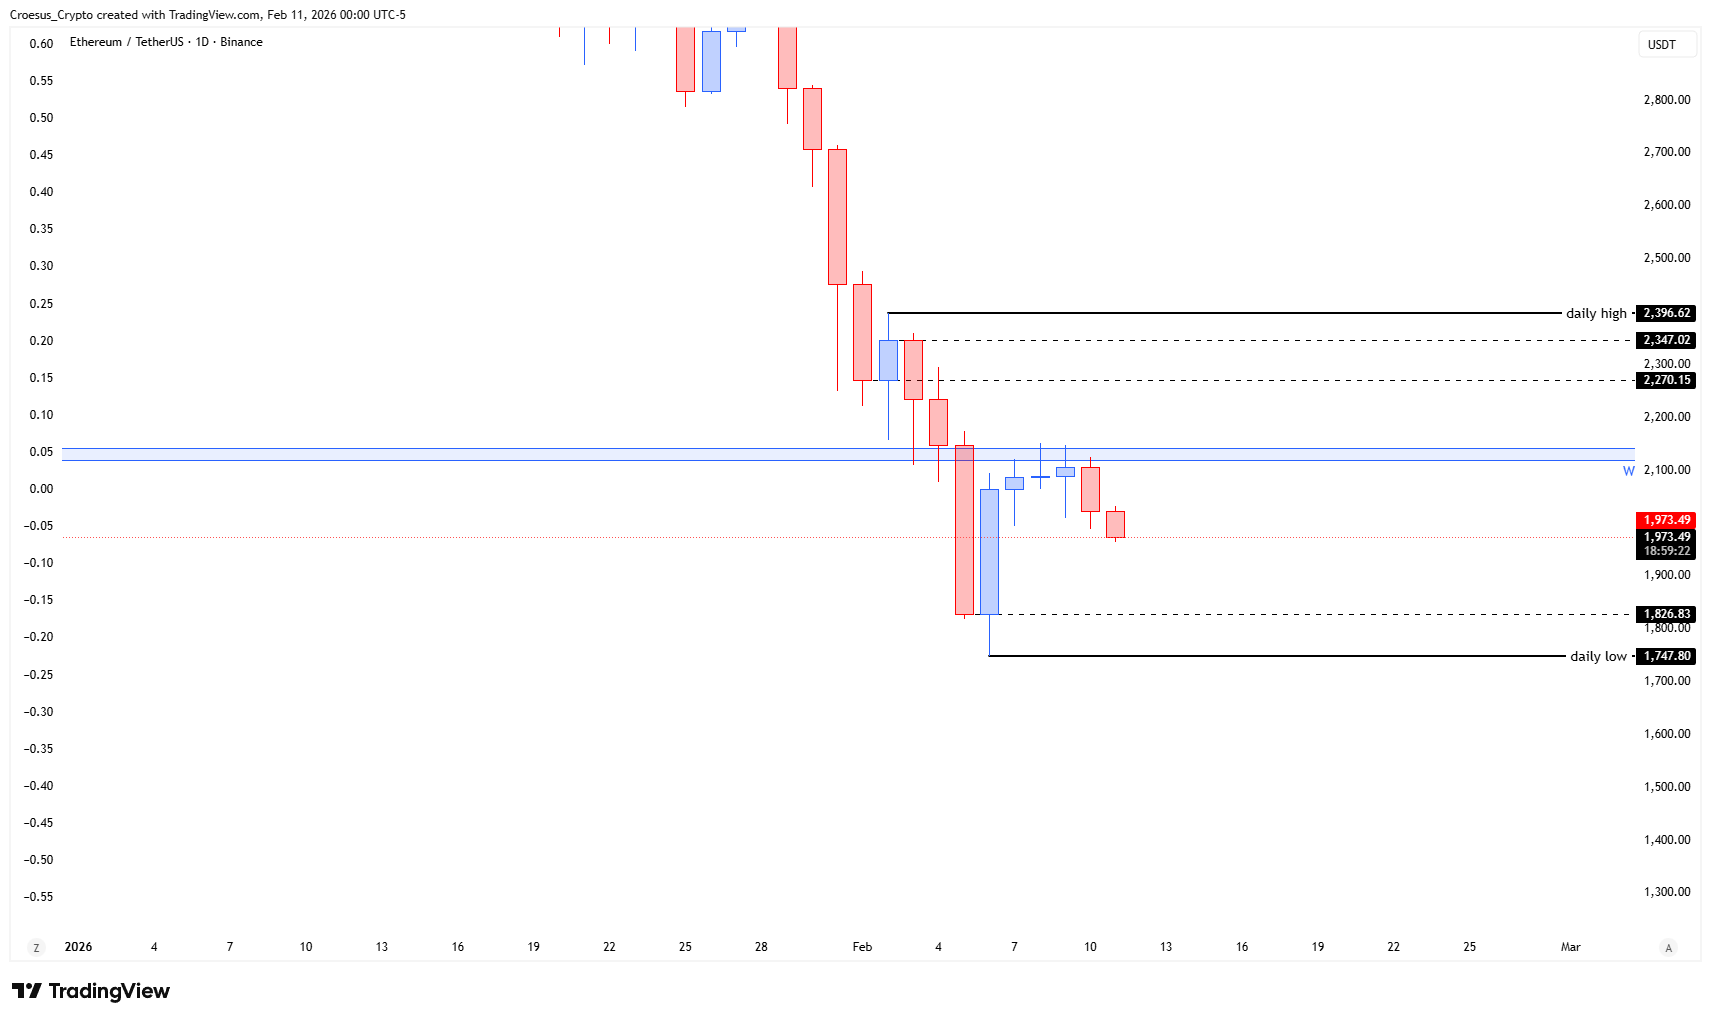
- clear bearish continuation
- same as with TOTAL and BTC : either we see an ABC correction, once we printed the B at the daily lows or we see bearish continuation, simply completing the bearish W set-up
- also here the weekly broken support that flipped to resistance remains a key level to reclaim.
Market Structure Analysis
From a technical analysis perspective, ETH has completed a strong impulsive leg down, followed by a sideways-to-slightly-up consolidation. This price action is typical for a corrective phase.
As with TOTAL and BTC, the structure can still evolve into an ABC correction, where the market could print a B leg around the daily lows before attempting a C leg relief rally.
However, the broader pattern also aligns with a developing bearish W setup, where failure to push higher from current levels would likely result in another impulsive leg lower and a new local low.
The weekly support resistance flip is the key structural pivot: as long as ETH trades beneath this zone, we treat any bounce as corrective inside a dominant bearish continuation trend.
Key Levels and Scenarios
Bullish scenario:
For a more constructive outlook, bulls need a clean ABC completion with higher lows and a decisive daily close back above the weekly resistance band. Only then would this Ethereum daily analysis start to shift from clear bearish continuation toward a more neutral or recovering structure.
Critical levels to watch:
- Weekly support-turned-resistance – main pivot; reclaiming it would weaken the bearish W narrative
- Current consolidation range – resolution of this range will likely dictate the next impulsive leg
- Daily low region – loss of these lows confirms bearish continuation and W completion
- Prior daily swing highs – only relevant if weekly resistance is reclaimed and trend begins to shift
Trading Implications
In our view, the better risk/reward remains in fading rallies into the weekly resistance area, while keeping sizing conservative and invalidation clearly placed above the flipped weekly zone given the possibility of an ABC relief rally.
This analysis is for informational purposes only and does not constitute financial advice.