ETH Marketcap / Ethereum
ETH daily analysis 11/03/2026. Ethereum is trading in a bearish context, with price repeatedly failing to reclaim the neckline and compressing inside a local range that keeps sellers in control.
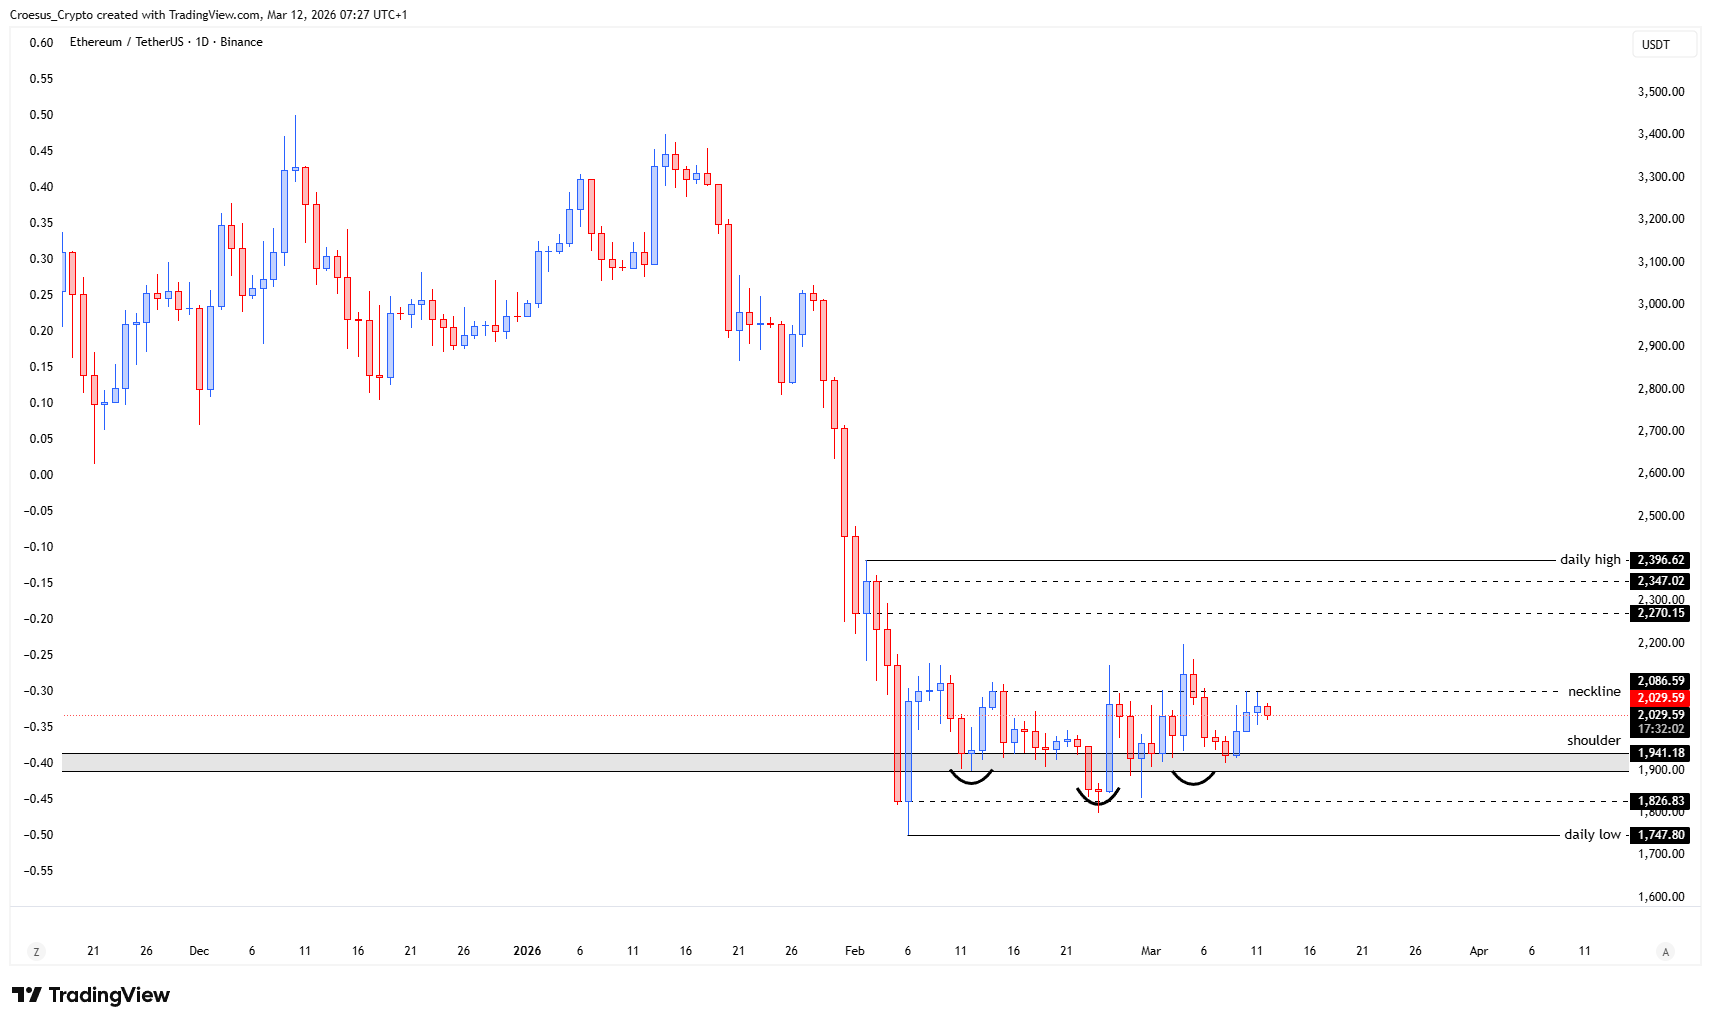
- The ETH price showed us a retest of the neckline for the second time, closing below the neckline again and remaining within the local range between the neckline and the shoulderlevel.
- This confirms the neckline as resistance for now.
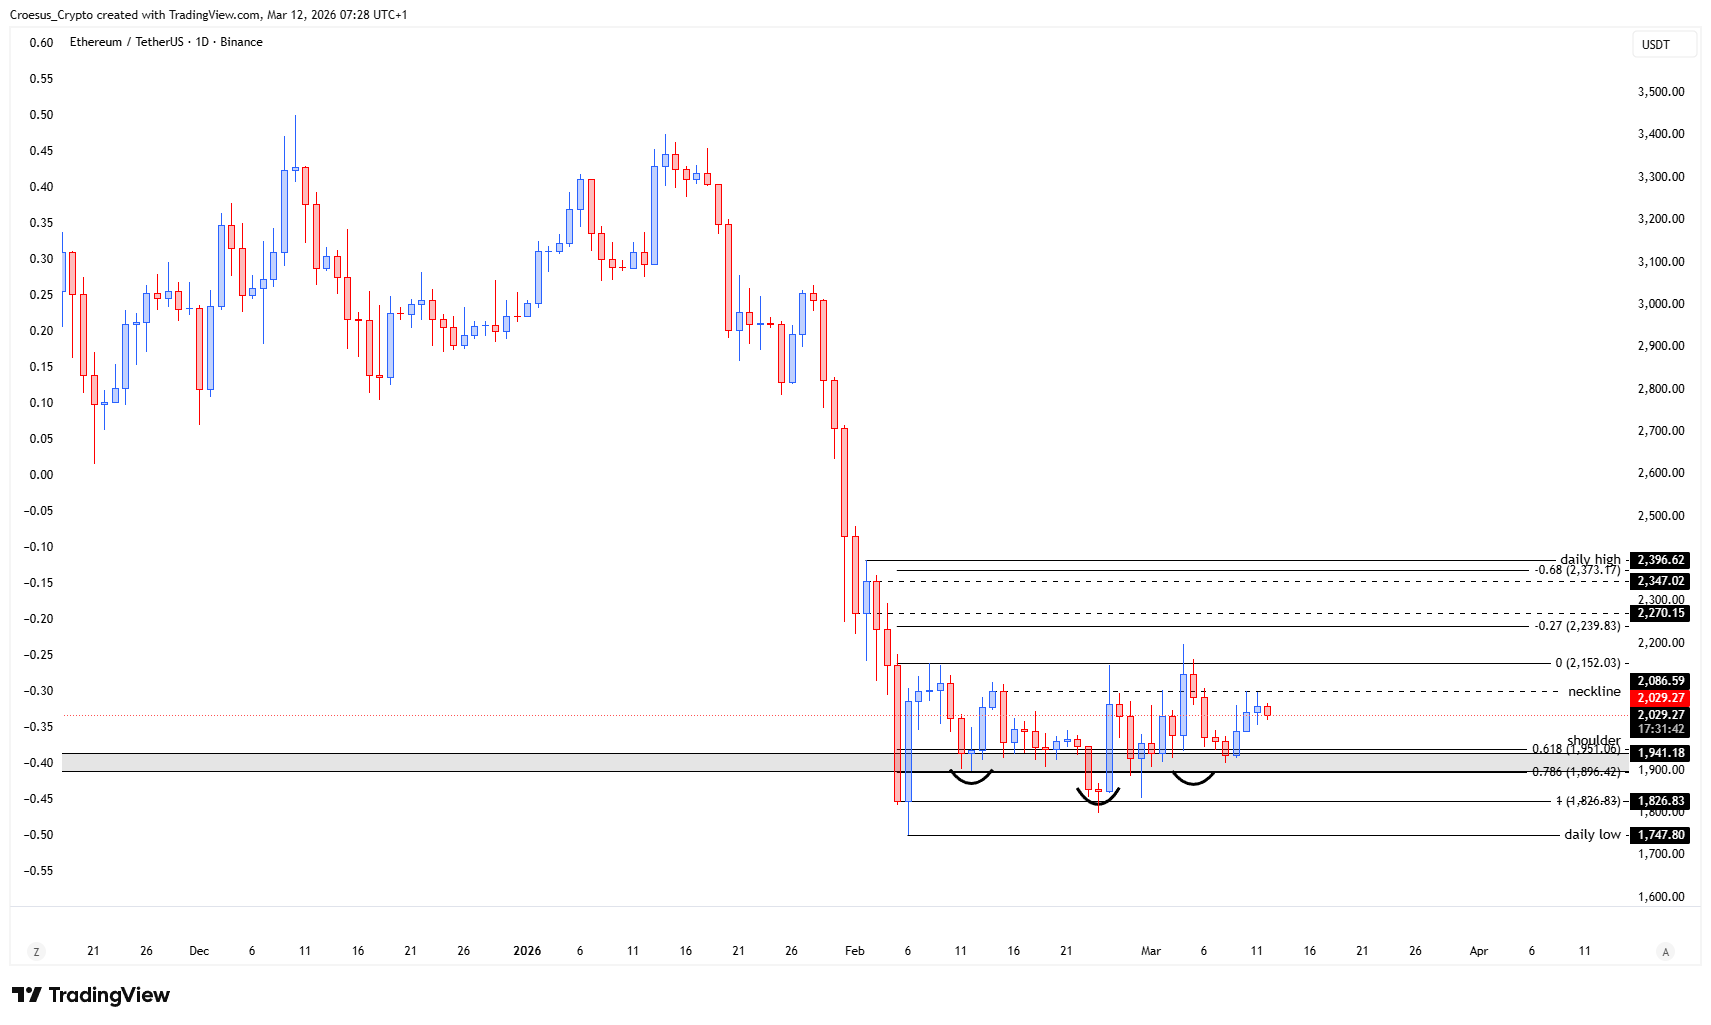
- Either we see a clear break and retest of the neckline to confirm the strength of the bulls
- Or we see a rejection and a bearish move down, searching possibly more liquidity for a next attempt to push through the neckline. Bearish targets could be the shoulderlevel or the head where there are some unmittigated liquidity points
Market Structure Analysis
From a market structure perspective, the second neckline retest followed by another close back below confirms that supply is still active at that horizontal level.
In our ETH daily analysis, this behaviour typically signals a corrective structure within a broader bearish environment: price probes higher into resistance, fails to accept above it, and rotates back into the range.
As long as ETH remains capped by the neckline, the local structure favours sellers defending the range high and forcing price to search for liquidity lower in the range. The “shoulderlevel” and the “head” act as the next structural areas where bids may step in, but they also represent zones where downside continuation can be fuelled if liquidity is taken and price does not reclaim prior structure.
Key Levels and Scenarios
The bullish path requires a clear break above the neckline followed by a retest that holds as support resistance flips in favour of the bulls. The bearish path is a clean rejection from the neckline that drives price back into the lower range, with continuation risk toward the shoulderlevel and potentially the head if liquidity is targeted.
- Neckline: key resistance; repeated closes below keep bearish control
- Local range high (at/near the neckline): rejection zone for bearish continuation
- Shoulderlevel: first structural downside target if the range breaks lower
- Head: deeper downside liquidity zone if selling extends
Trading Implications
While ETH remains below the neckline, risk skews toward trend continuation and failed-break setups rather than chasing upside. More conservative participants typically wait for a break-and-retest confirmation above the neckline, while aggressive participants focus on rejection signals at resistance and structure breaks within the range.
This analysis is for informational purposes only and does not constitute financial advice.