


Our Ethereum daily analysis for 12 December 2025 tracks how the inverse head and shoulders reversal pushed price higher into the Fibonacci extension target before sellers stepped in, and how current price action builds a potential bullish M over a key psychological support.
Ethereum daily chart December 2025 highlighting bullish M formation and support zone around the $3,000 psychological level
Technical Analysis Key Points
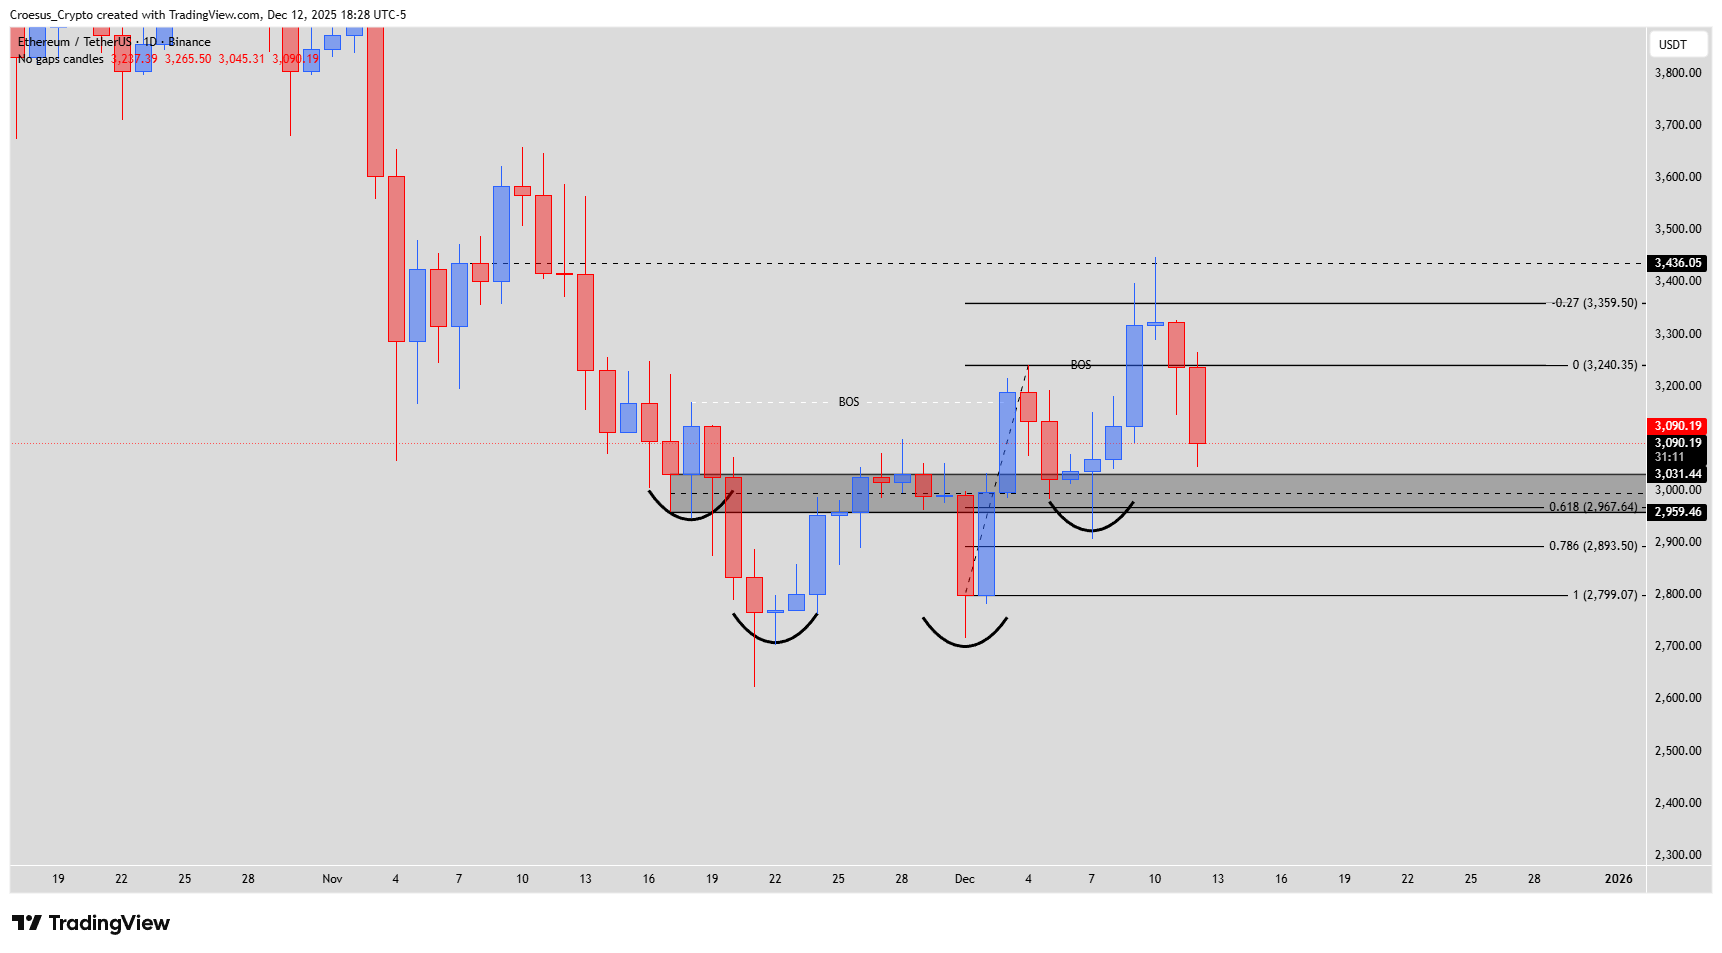
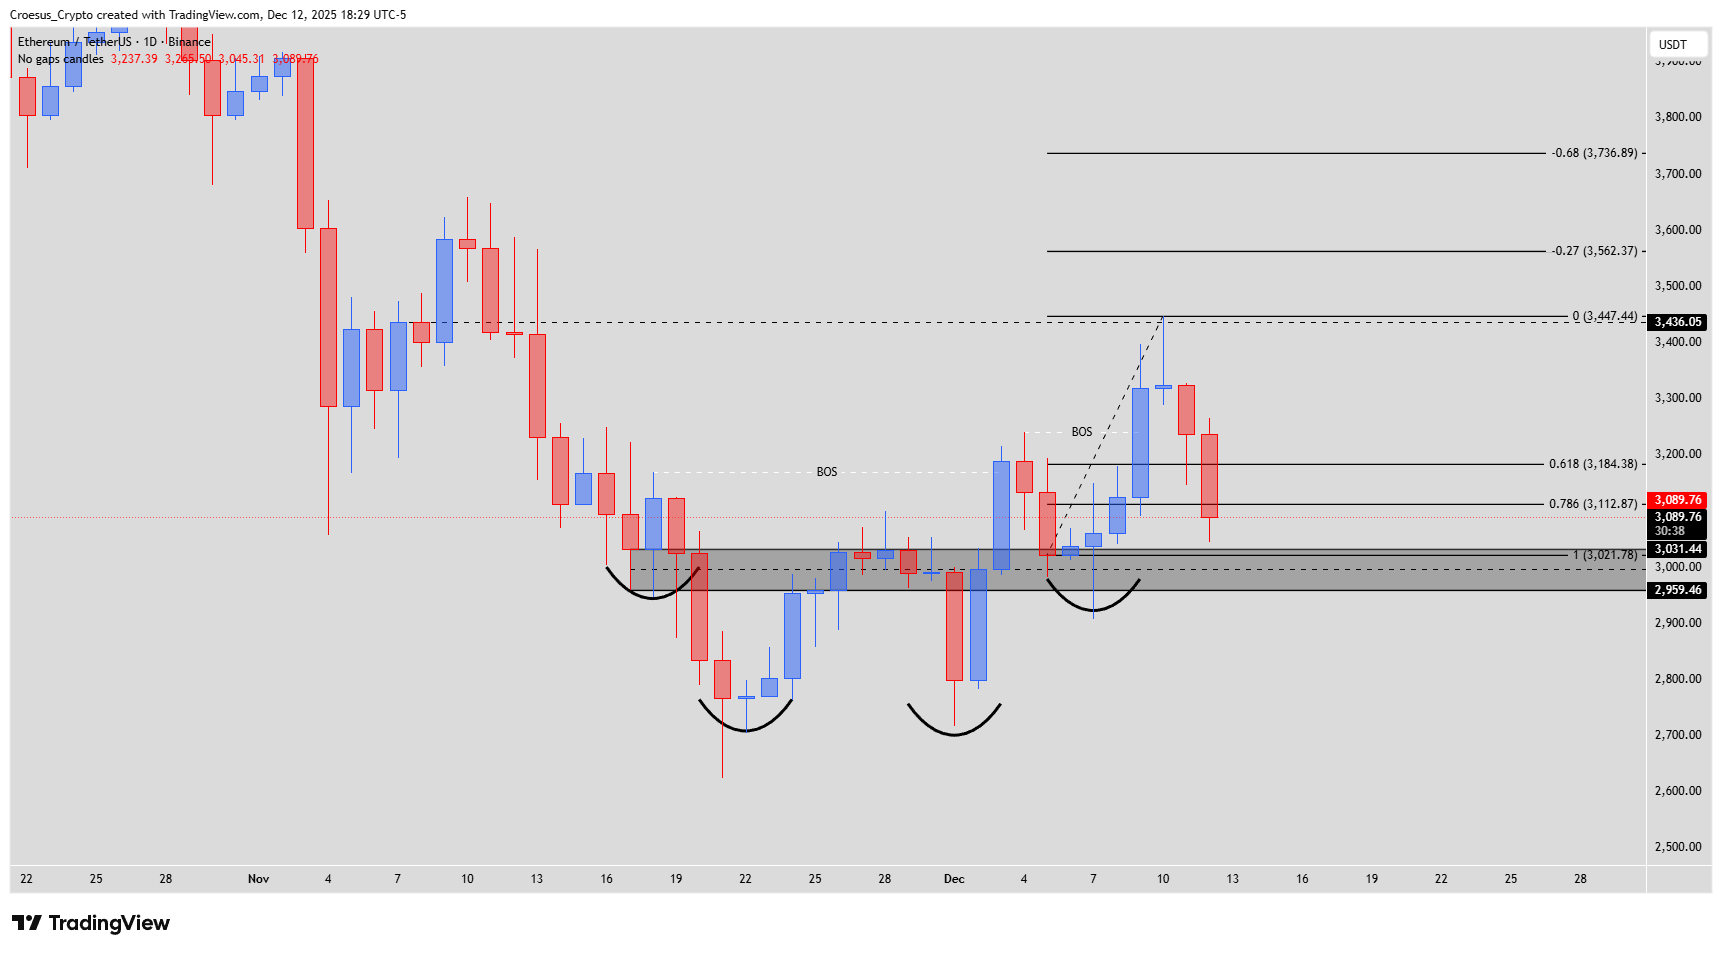
- Please note that the inverse head and shoulders pattern played out nicely until the fib level -0.27 where we saw the price make a bearish correction.
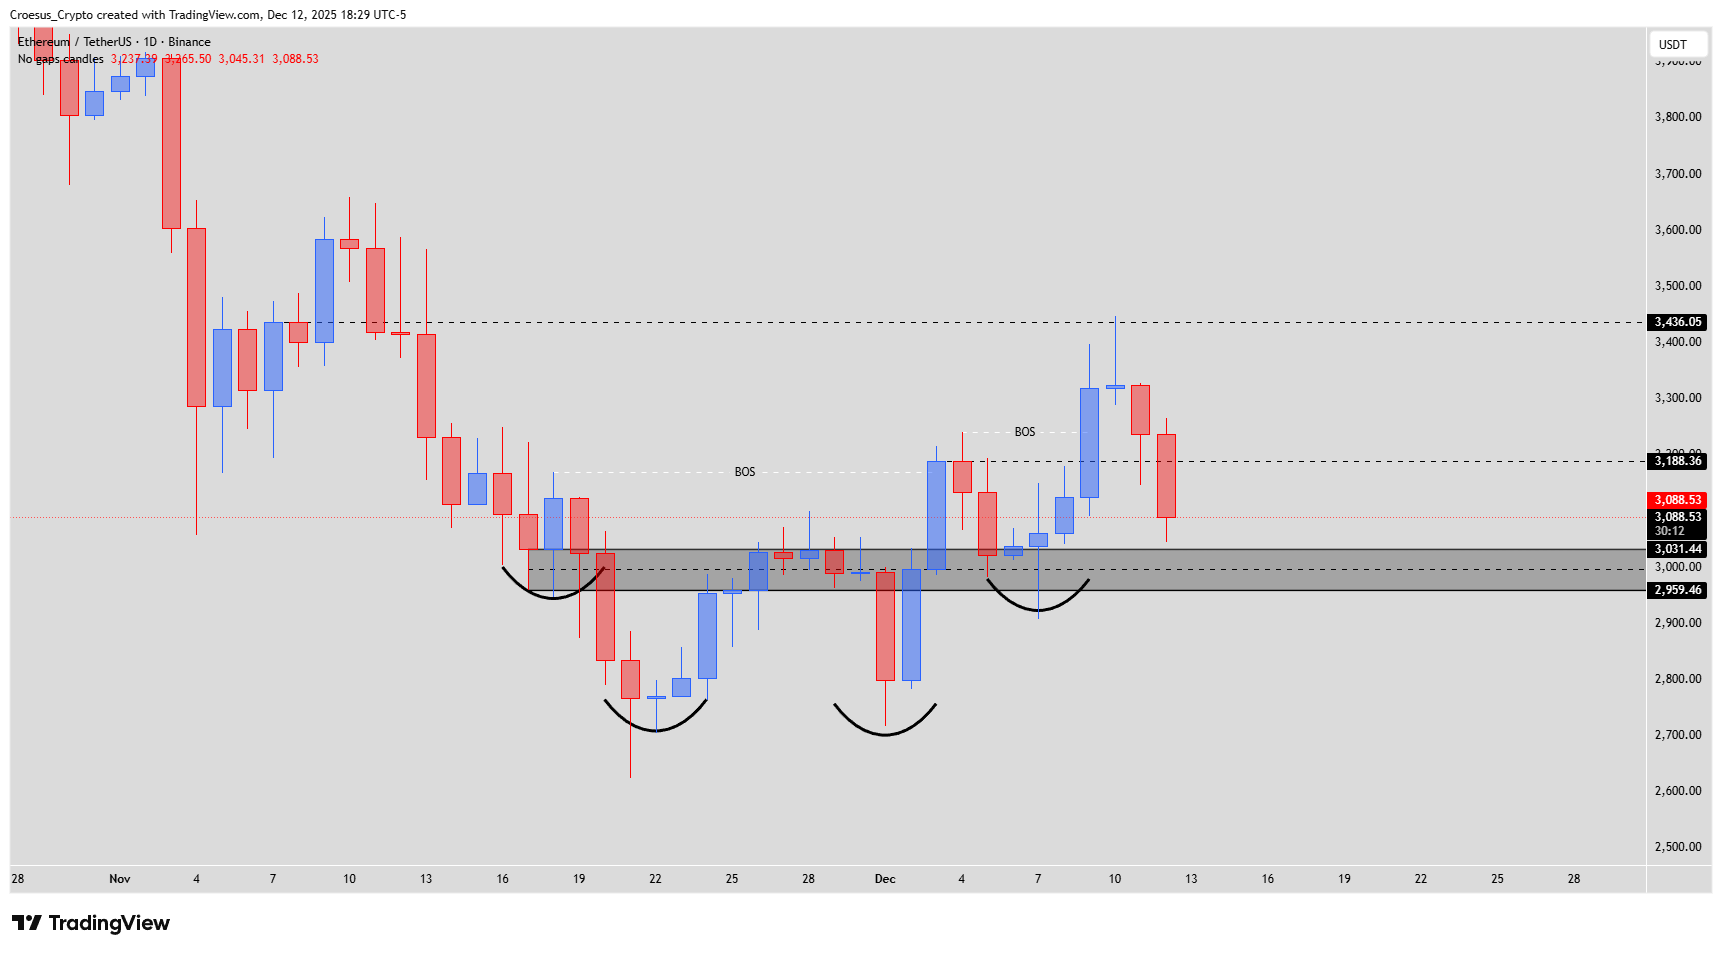
- At this moment we see a bullish M with a possible support around the $3.000 level which is a psychological level.
- If we see a bullish reaction on the $3.000 level, we have to be aware that this also could potentially be the start of a head and shoulder pattern with the $3.188,36 level as a potential shoulder level. When hitting that level be sure to at least then put your stoploss to break even.
Market Structure Analysis
From a technical analysis perspective, Ethereum broke structure to the upside out of the inverse head and shoulders base, with consecutive BOS prints and a strong impulsive leg into the -0.27 Fibonacci extension.
That zone aligned with prior resistance and triggered a sharp corrective move lower. Price is now rotating back into the grey demand area around $2,960–3,030, which combines the old neckline, local BOS area and key Fibonacci retracements of the last impulse.
The developing bullish M suggests buyers are still active at this support resistance flip zone, as long as the $3,000 region holds on a daily closing basis. The $3.188,36 level might act as a resistance level and a shoulder level for a potential H&S pattern
Key Levels and Scenarios
Bullish scenario: If the $3,000 psychological level holds and the bullish M confirms with a higher low, Ethereum daily analysis favours continuation higher towards $3,188 first and then a re-test of the $3,436–3,447 high and extension targets.
Key levels to watch:
$3,436–3,447 – Recent swing high / 0% Fib; break reopens upside extension path
~$3,188 – Local resistance and origin of the current correction
$3,030–3,000 – Main support zone and neckline retest; psychological level for buyers
~$2,959 – 0.618 Fibonacci retracement of the impulsive leg : key bullish invalidation
$2,893–2,800 – 0.786–1 Fibonacci zone : loss would shift bias more clearly bearish
Trading Implications
As long as price holds above the $3,030–3,000 zone, we see better risk/reward on long ideas inside this demand area, with invalidation placed below the 0.618–0.786 Fibonacci cluster ($2,959–2,893) and upside targets at $3,188 and $3,436+.
If $3,000 fails on a daily close, the setup flips: bounces back into $3,000 from below can become lower-risk short entries aiming for the deeper Fib supports near $2,800.
Position sizing should stay conservative given we are trading inside a corrective structure, with leverage increased only after a clear break and hold beyond either the $3,447 high or the $2,800 low.
This content is for educational purposes only and is not financial advice or a recommendation to buy or sell any asset.