


ETH Marketcap / Ethereum
In this ETH daily analysis for 12 February 2026, we see the first signs of buyers stepping back in after a strong impulsive selloff. Price has stalled just above the recent “daily low” zone and, similar to BTC and TOTAL, is transitioning from a vertical drop into a slower, overlapping corrective structure that could evolve into an ABC pattern.
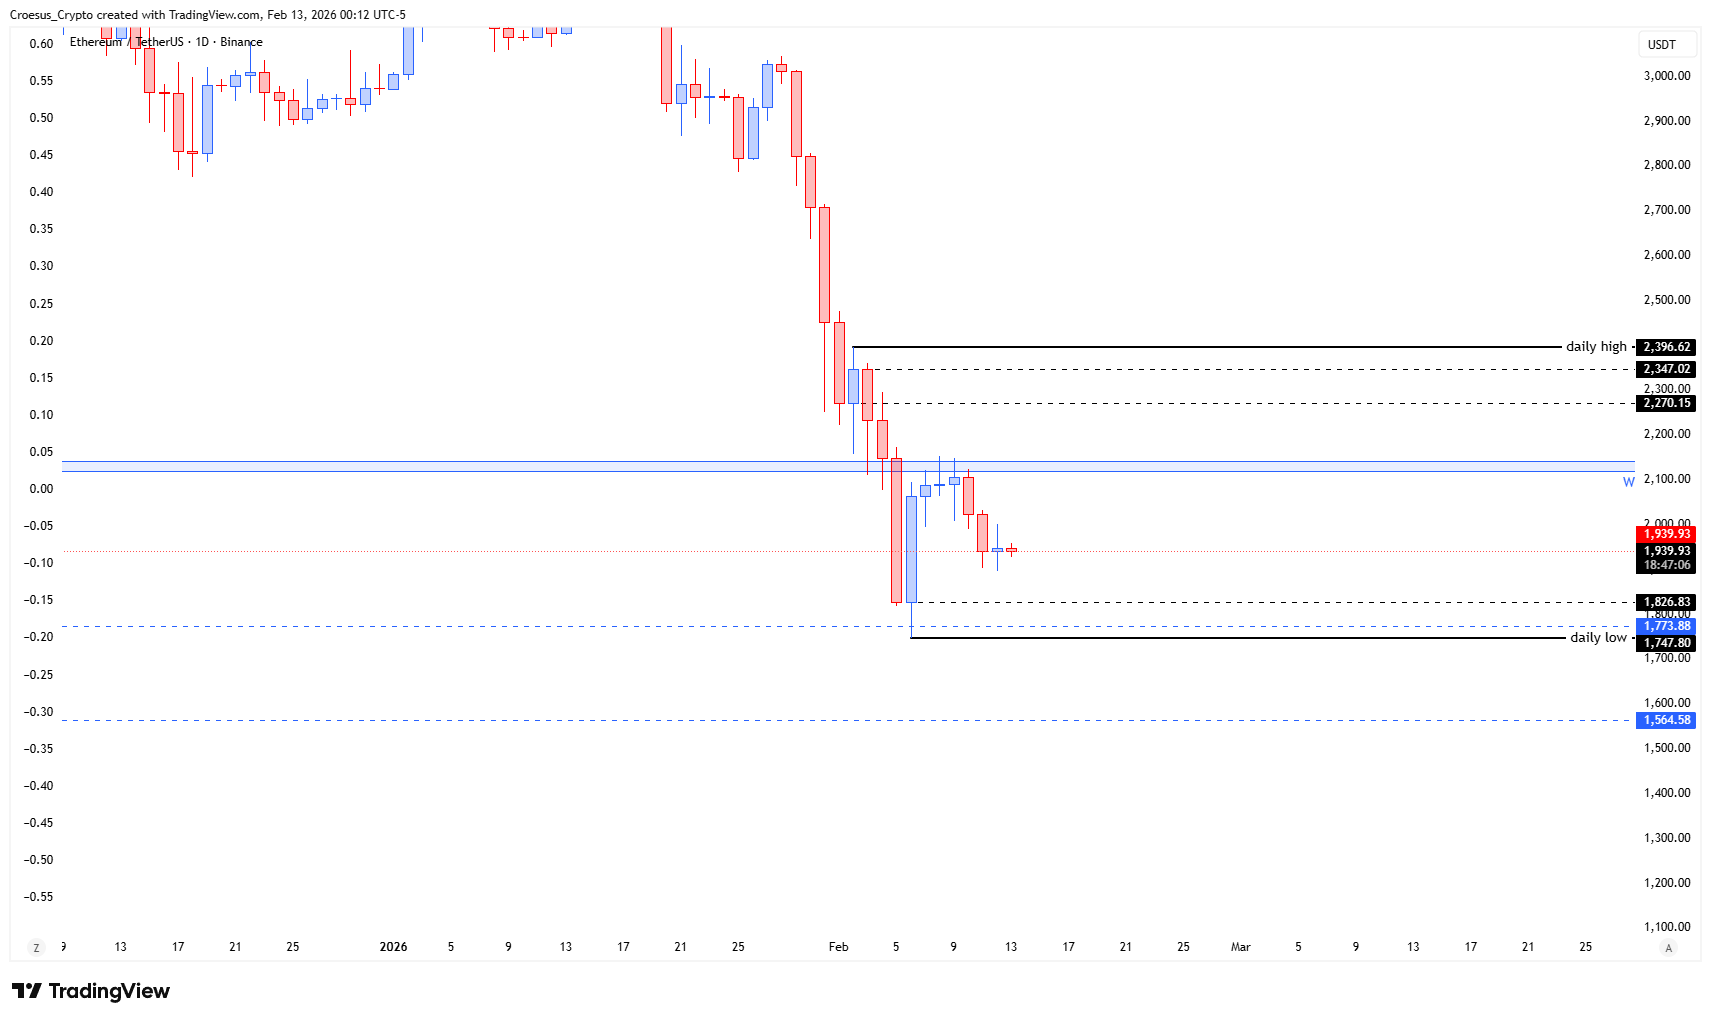
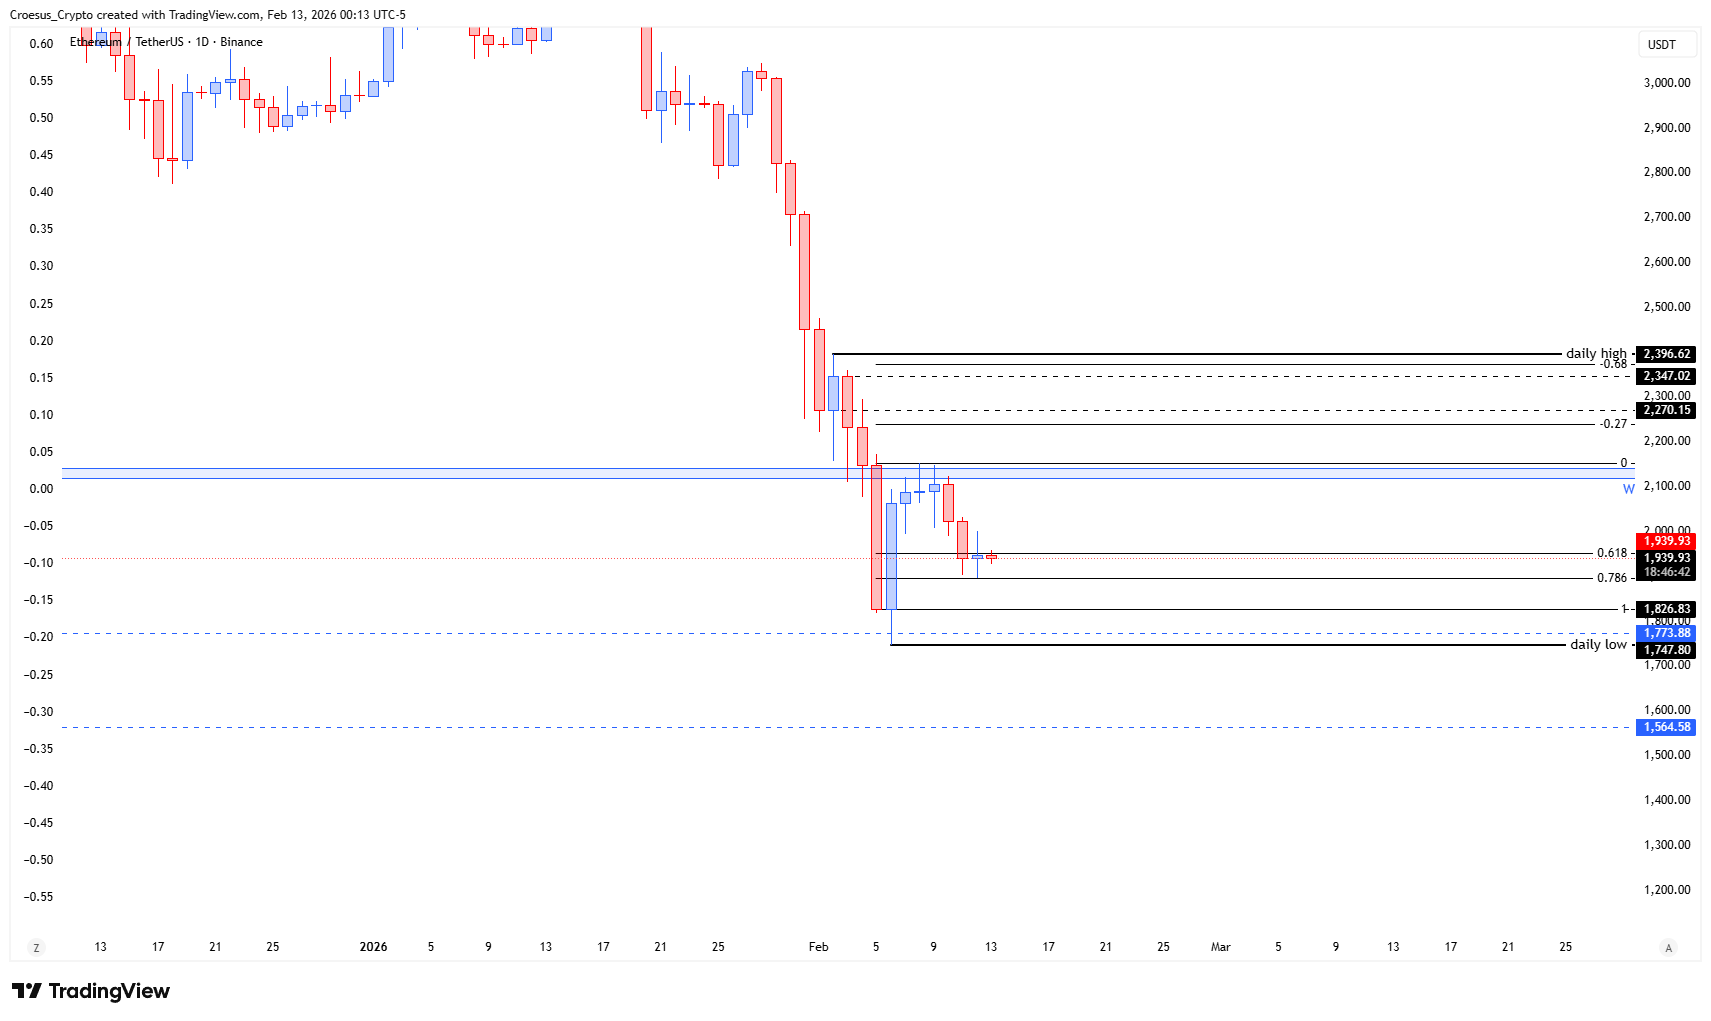
- ETH's price is showing us a first smaller bullish candle indicating us some presence of the bulls willing to slow down the bearish correction
- this could fit into a ABC-correction, where we would be printing or searching to print the B-leg
- If it would play out, this would give some bullish correction. Nevertheless still within a larger bearish pattern.
Market Structure Analysis
From a market structure perspective, ETH sold off impulsively from the 2,396 “daily high” area and found demand around the 1,747–1,775 support pocket, where we now see the first smaller bullish candle. This deceleration suggests the A-leg of the move may be complete and that price is searching for a B-leg retracement within an ABC correction. The $1,826 short-term pivot above the daily low is the first level bulls need to reclaim to confirm that buyers are defending this zone. Overhead, $2,100 marks a key mid-range line, while the $2,270–2,347 band and the $2,396 daily high compose a strong resistance cluster likely to cap any initial bounce. As long as ETH remains below this broader supply area, the higher-timeframe trend stays bearish despite any near-term bullish correction.
Key Levels and Scenarios
Bullish scenario in this ETH daily analysis: buyers defend the 1,747–1,775 support band and push price into a corrective rally towards 2,100 first, with possible extensions into 2,270–2,347 as the B-leg completes.
Critical levels to watch:
- $1,747 (daily low) – Primary downside invalidation; loss suggests the C-leg is starting.
- 1,775–1,826 – Short-term support and pivot; holding here keeps the B-leg thesis alive.
- 2,100 – Mid-range resistance and first objective for any bounce.
- 2,270–2,347 – Major resistance cluster, ideal zone to monitor for B-leg exhaustion
- 2,396 (daily high) – Key macro resistance; only a sustained break would weaken the broader bearish structure.
Trading Implications
Because this remains a potential countertrend B-leg inside a larger bearish pattern, we favour cautious long exposure with tight invalidation below the daily low and a focus on taking profits into resistance bands rather than chasing continuation, while aggressive traders may look to rejoin the dominant trend if price rejects the 2,100–2,347 region.
This analysis is for informational purposes only and does not constitute financial advice.