


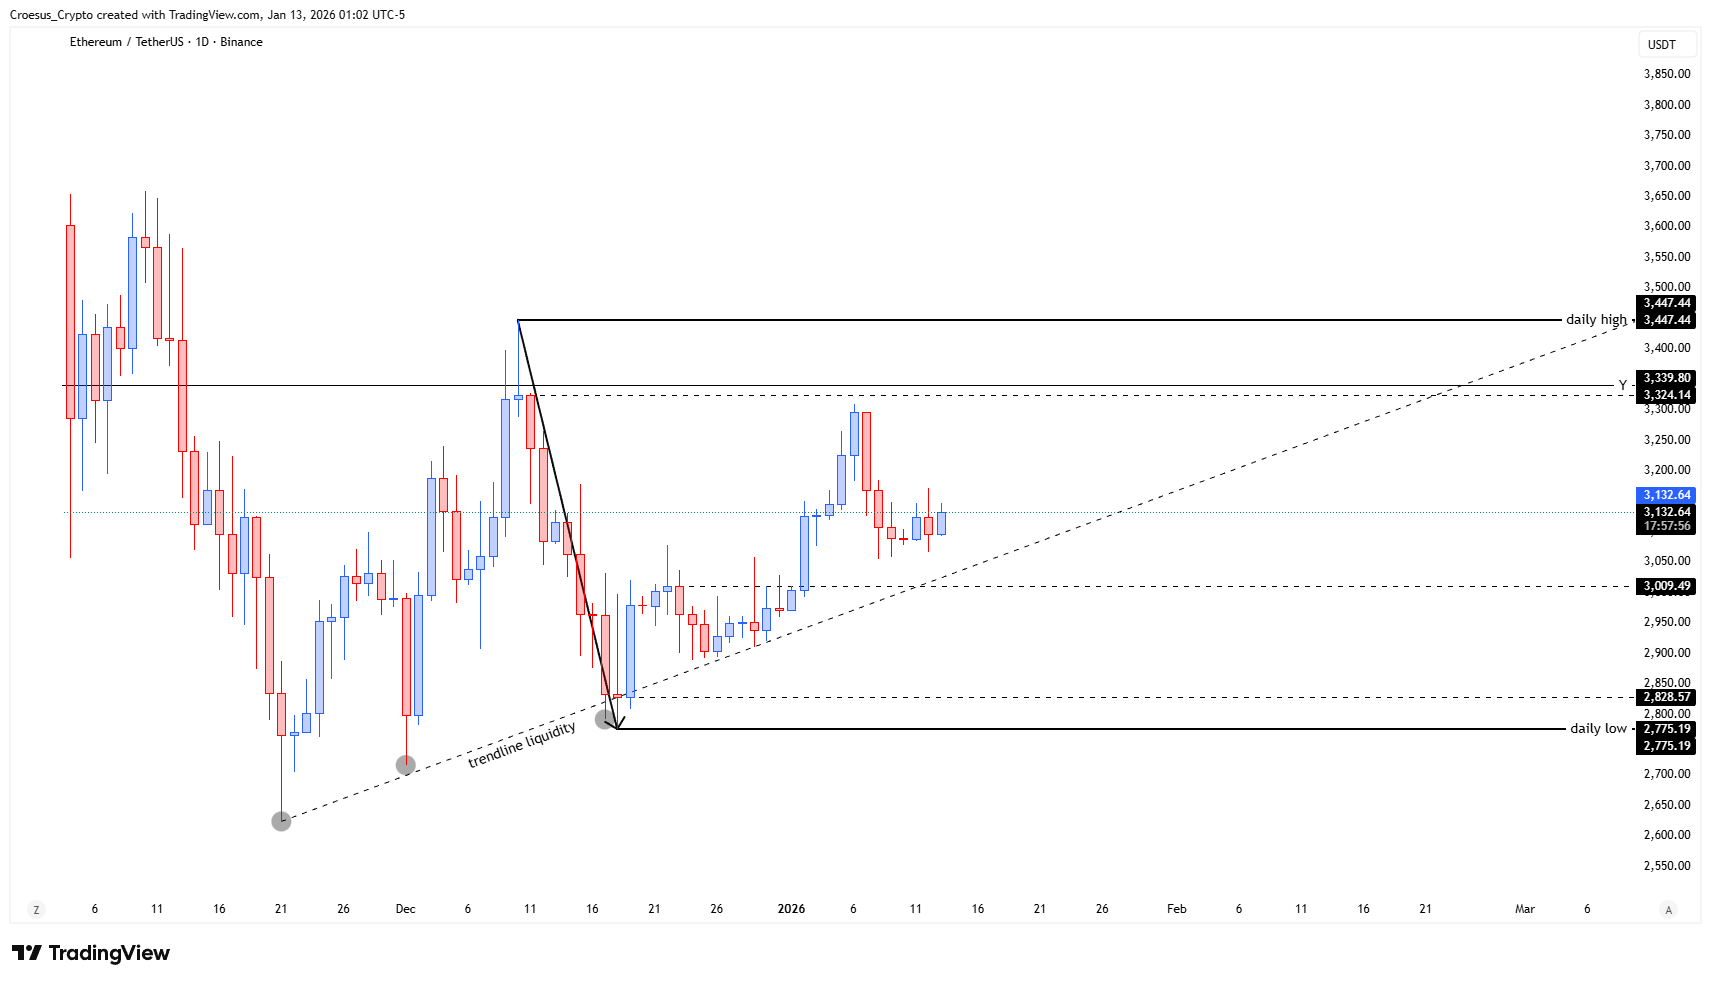
In this ETH daily analysis for 12 January 2026, we see a slightly different structure compared with TOTAL and BTC, but price is still trading within a clear daily range and remains in corrective mode. Our technical analysis focuses on how price behaves around the yearly level, the daily high near 3,447 and the rising trendline from the December low.
ETH daily chart 12 January 2026 showing daily range, yearly level, rising trendline from December lows, and resistance at 3,447 daily high
Technical Analysis Key Points
- here we can see a slightly different development than TOTAL and BTC. But also here the price is still in the daily range and correcting.
- Bullish : a break and retest of the yearly level and the daily high, would give us more certainty that bulls are kicking in and major levels are broken.
- Bearish : The price retests the Yearly high and gets rejected again printing a double top, possibly breaking the upwards trendline.
Market Structure Analysis
Structurally, ETH is consolidating between the daily low around 2,775 and the daily high near 3,447, with an intermediate level around 3,009 acting as a pivot in the current support resistance map. After the sharp December sell-off, price reclaimed the rising trendline and has been grinding higher within the range, but without a decisive breakout. Where BTC and TOTAL already showed fakeouts through the range high, ETH has so far respected its daily resistance more cleanly, keeping the bias neutral in this ETH daily analysis.
The yearly level just below the daily high (around the 3,330 area) now forms a key cluster of resistance. A clean move through this confluence would confirm renewed bullish momentum.
Key Levels and Scenarios
Bullish scenario: For our ETH daily analysis to turn clearly bullish, we want to see a strong breakout and retest of the yearly level and then the daily high near 3,447, turning that area into support and opening the door toward higher targets above 3,500.
Critical levels to watch:
3,447 daily high: Major resistance; a close and retest above confirms bullish continuation.
Yearly level (~3,330): First breakout trigger; failure here keeps ETH trapped in range.
3,009 mid-range level: Short-term support / resistance flip zone inside the range.
Rising daily trendline: Loss of this structure would signal waning bullish pressure.
2,775 daily low: Key support; a break below suggests a deeper corrective phase.
Trading Implications
As long as ETH trades between the daily low and the daily high, we view conditions as range-bound: breakout traders can wait for confirmation above the yearly level, while mean-reversion traders may look for reactions at extremes, always sizing positions conservatively and respecting invalidation beyond key support resistance levels.
This content is for educational purposes only and is not financial advice or a recommendation to buy or sell any asset.