ETH Marketcap / Ethereum
ETH daily analysis 13/03/2026. Ethereum is attempting to transition from a daily relief bounce into a more meaningful reversal, but price is still reacting to a key neckline area while the broader daily and weekly structure remains bearish.
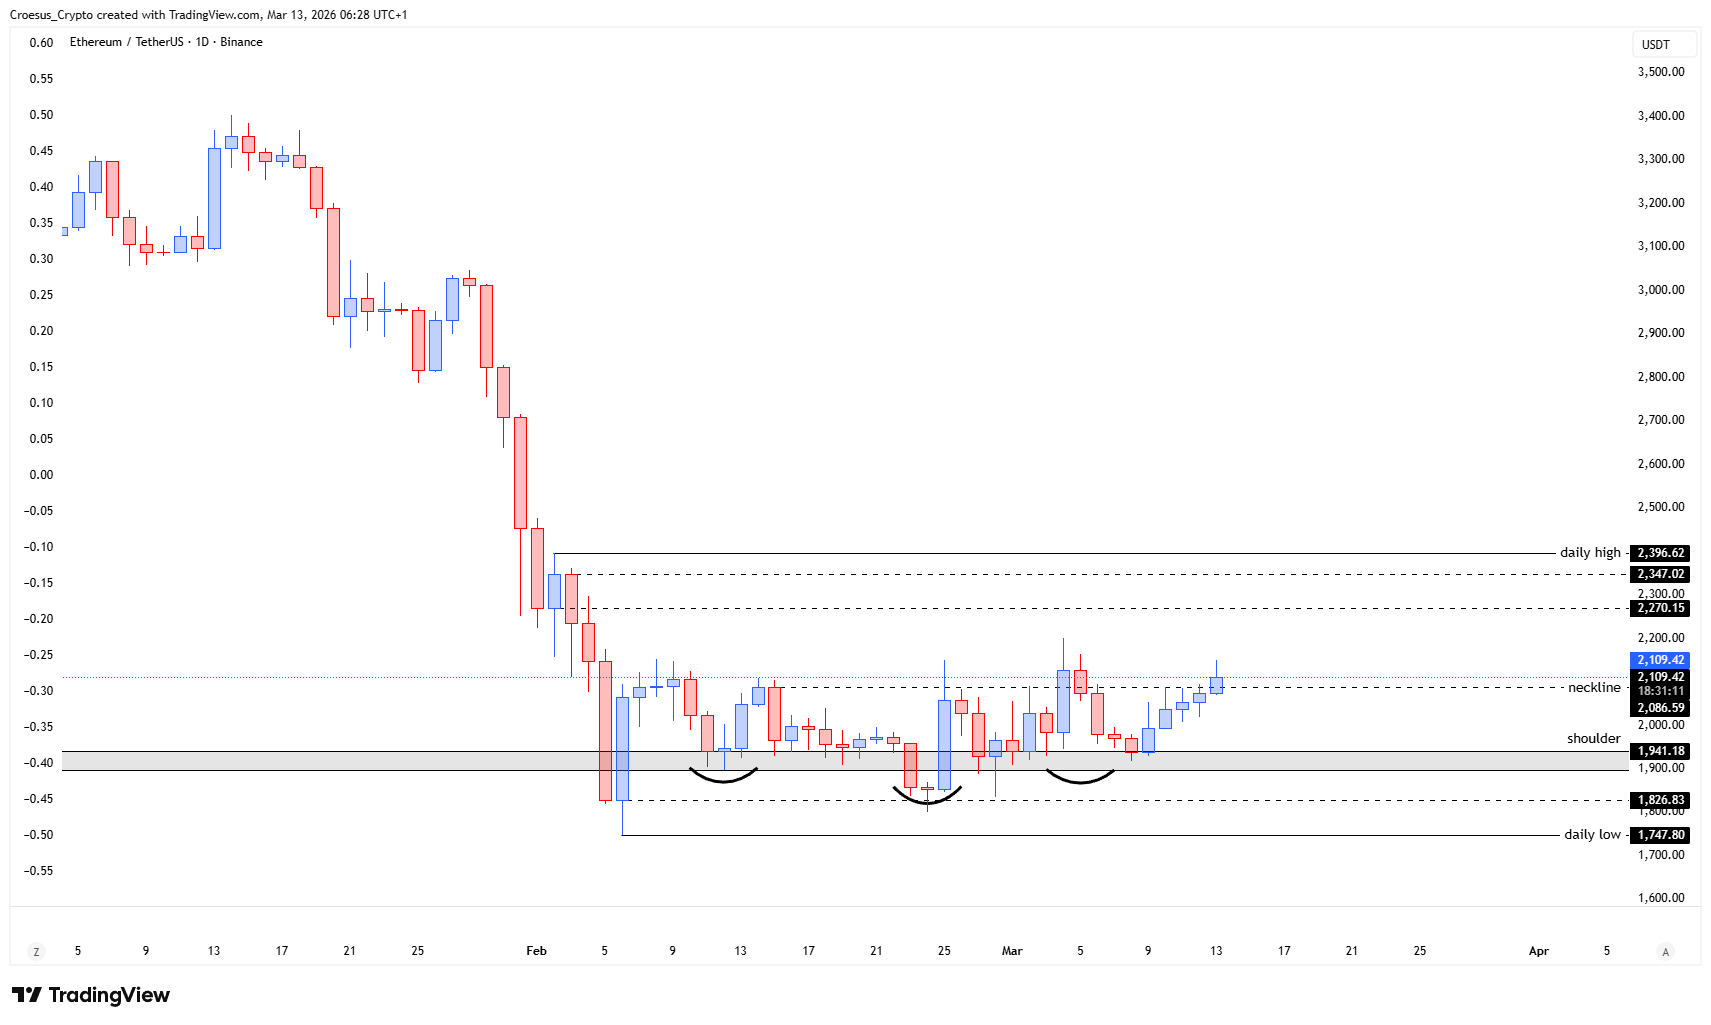
- The ETH price shows us a next attempt to break the neckline but not succeeding to close above it (yet)(ignore the last candle is this candle is not closed yet)
- If the price closes above the neckline we could see a bullish continuation of the daily relief. If not, we could see a next retest of shoulder or even a bearish continuation, as the price is still in a larger daily ànd weekly downtrend.
Market Structure Analysis
Our ETH daily analysis focuses on a clean market structure decision point: price is pressing into the neckline, but the market has not confirmed a break with acceptance (a close above).
Structurally, that keeps this move classified as a corrective attempt inside a larger bearish context rather than a confirmed trend reversal. When price repeatedly tests a neckline and fails to close above, it often signals that supply is still active at that horizontal resistance and that the relief rally can remain capped.
If bulls do get a daily close above the neckline, it shifts the short-term structure toward continuation of the relief leg, with the neckline acting as potential support resistance flipped on any retest. If the close fails again, the bearish structure stays intact and a rotation back toward the shoulder area becomes the more natural support resistance path, with downside continuation risk still present given the higher-timeframe downtrend.
Key Levels and Scenarios
In this ETH daily analysis, the neckline is the primary trigger level. Bullish continuation requires a daily close above the neckline and follow-through that holds on a retest. Failure to close above keeps the move corrective and increases the probability of a pullback into the shoulder zone, with bearish continuation remaining on the table as long as the daily and weekly trend stays pressured.
- Neckline: needs a daily close above to confirm acceptance and extend the relief move
- Neckline retest: key area to watch for support resistance flip after any breakout
- Shoulder zone: likely retest target if price fails to close above the neckline
- Broader daily and weekly downtrend structure: keeps downside continuation risk active
Trading Implications
Aggressive participants typically treat neckline interactions as high-volatility decision zones, while conservative traders often wait for a confirmed close and retest to avoid false breaks. Risk is elevated while price is still negotiating the neckline, because the same level can act as both breakout trigger and rejection point.
This analysis is for informational purposes only and does not constitute financial advice.