


ETH Marketcap / Ethereum
ETH daily analysis 13-04-2026. Ethereum is trading in a bearish context while price retests a prior daily high, creating a key decision area where a short-term technical bounce can develop even if the higher-level pressure remains to the downside.
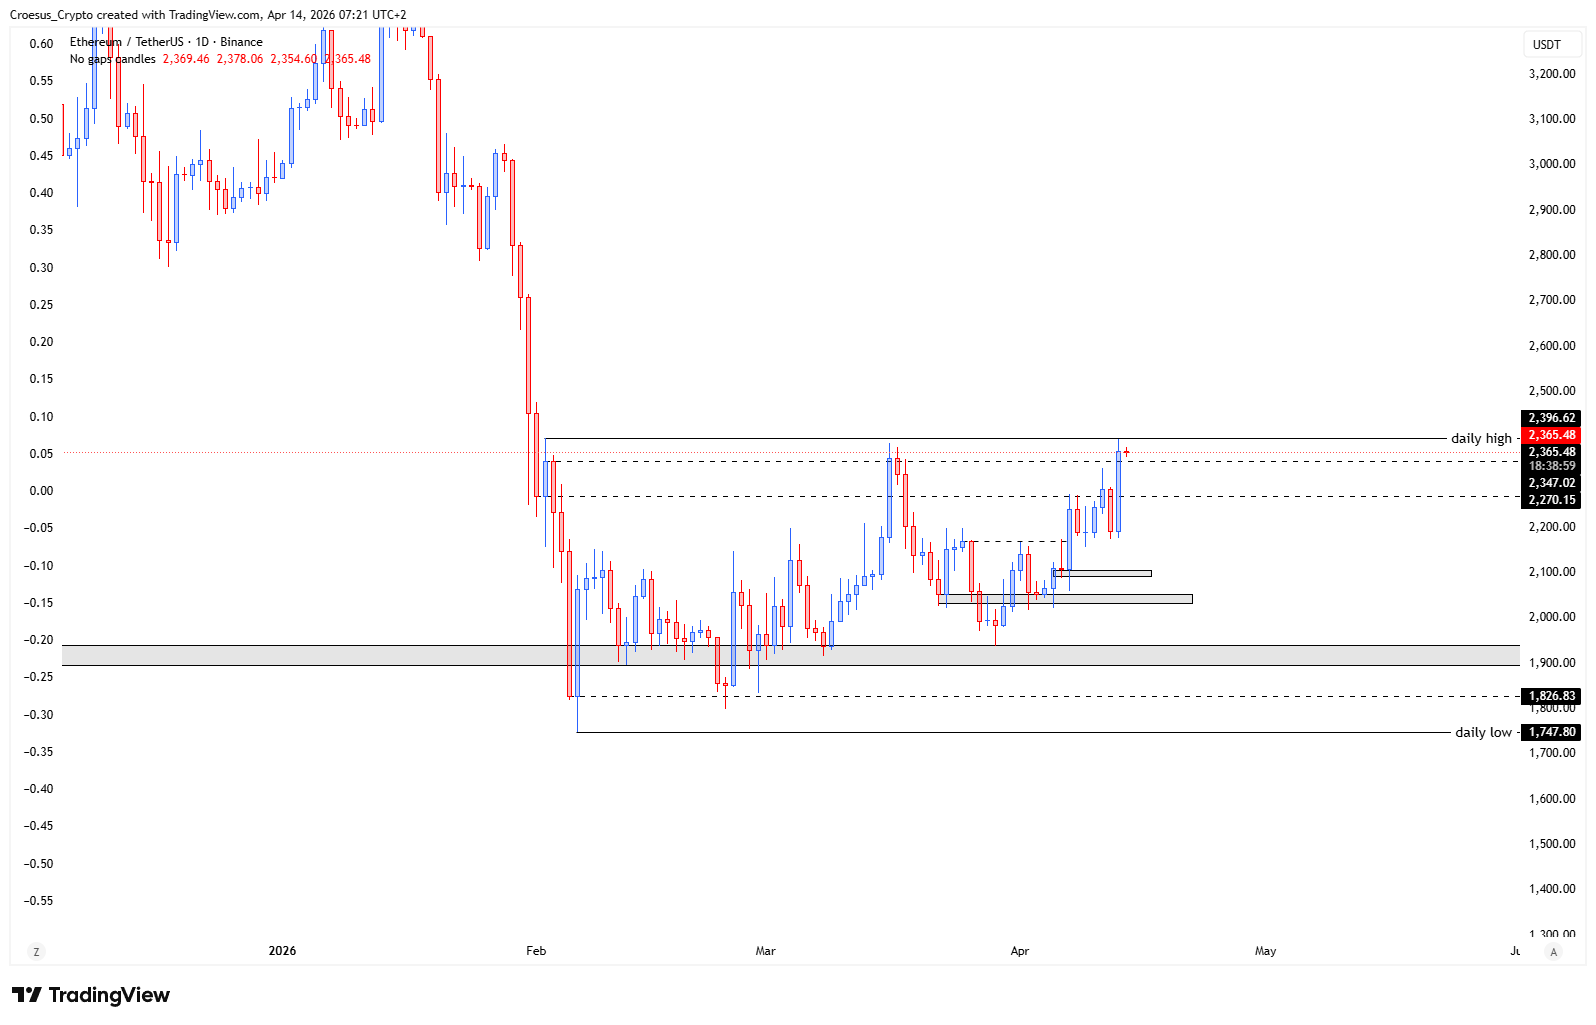
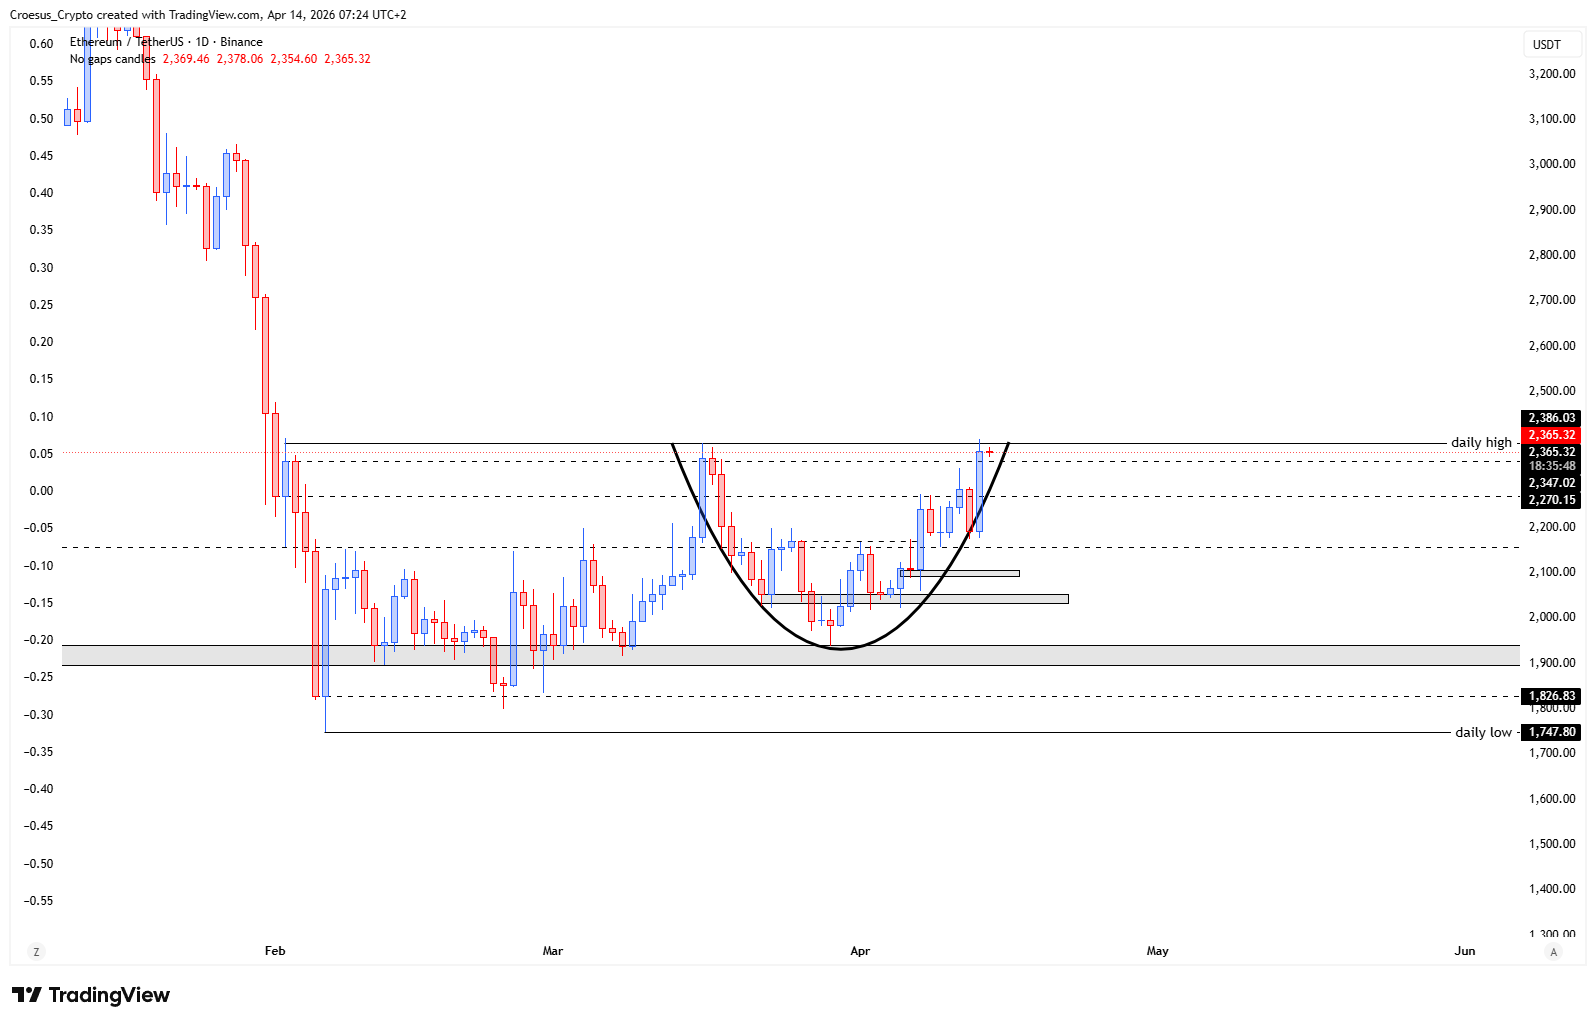
- The ETH price shows us that the daily high is retested, touching the rim of a potential cup and handle pattern.
- If this pattern plays out, we might see a (temporary) relieve. The zone 2000 - 2100 $ remains untested.
Market Structure Analysis
From a naked-trading perspective, our ETH daily analysis focuses on how price behaves around the prior daily high and the “rim” area of the potential cup and handle.
A retest of a daily high often acts as a clean horizontal resistance check: if the retest holds and sellers defend the level, the move is typically corrective within the bearish trend.
However, if price starts accepting above that level and builds a tight handle (a controlled corrective structure rather than an impulsive dump), that is often the market telegraphing a short-term relief move.
The mention of the untested 2000 - 2100 $ zone is also structurally important: untested zones frequently act as magnets during bearish phases, especially if the market fails to reclaim and hold above the retested high.
Key Levels and Scenarios
For this ETH daily analysis, the core support resistance framework is simple: the retested daily high is the immediate decision level, while the untested 2000 - 2100 $ zone is the next major area to monitor if bearish continuation resumes. A bullish (relief) scenario requires buyers to hold the rim/handle structure and reclaim the retest area with acceptance. A bearish scenario remains valid if price rejects the retested daily high and rotates lower into the untested zone.
- The retested daily high as the key resistance/decision level
- The rim/handle area as the nearby structural support to hold for a relief bounce
- The zone 2000 - 2100 $ as an untested downside target area if rejection plays out
Trading Implications
In a bearish trend, relief setups typically offer shorter windows and require cleaner confirmation. Conservative positioning generally waits for acceptance above the retested level, while aggressive traders focus on rejection signals at resistance. Risk management remains defined by whether price holds the reclaimed area or fails and rotates back into the lower zone.
This analysis is for informational purposes only and does not constitute financial advice.