


In this Ethereum daily analysis for 14 January 2026, we see ETH reacting at a key higher-timeframe Yearly level while also tagging the Fibonacci -0.27 completion of the current leg. Our technical analysis suggests that, with the daily high still intact and price trading inside a clear range, some short-term relief to the downside is likely before any sustained trend move develops.
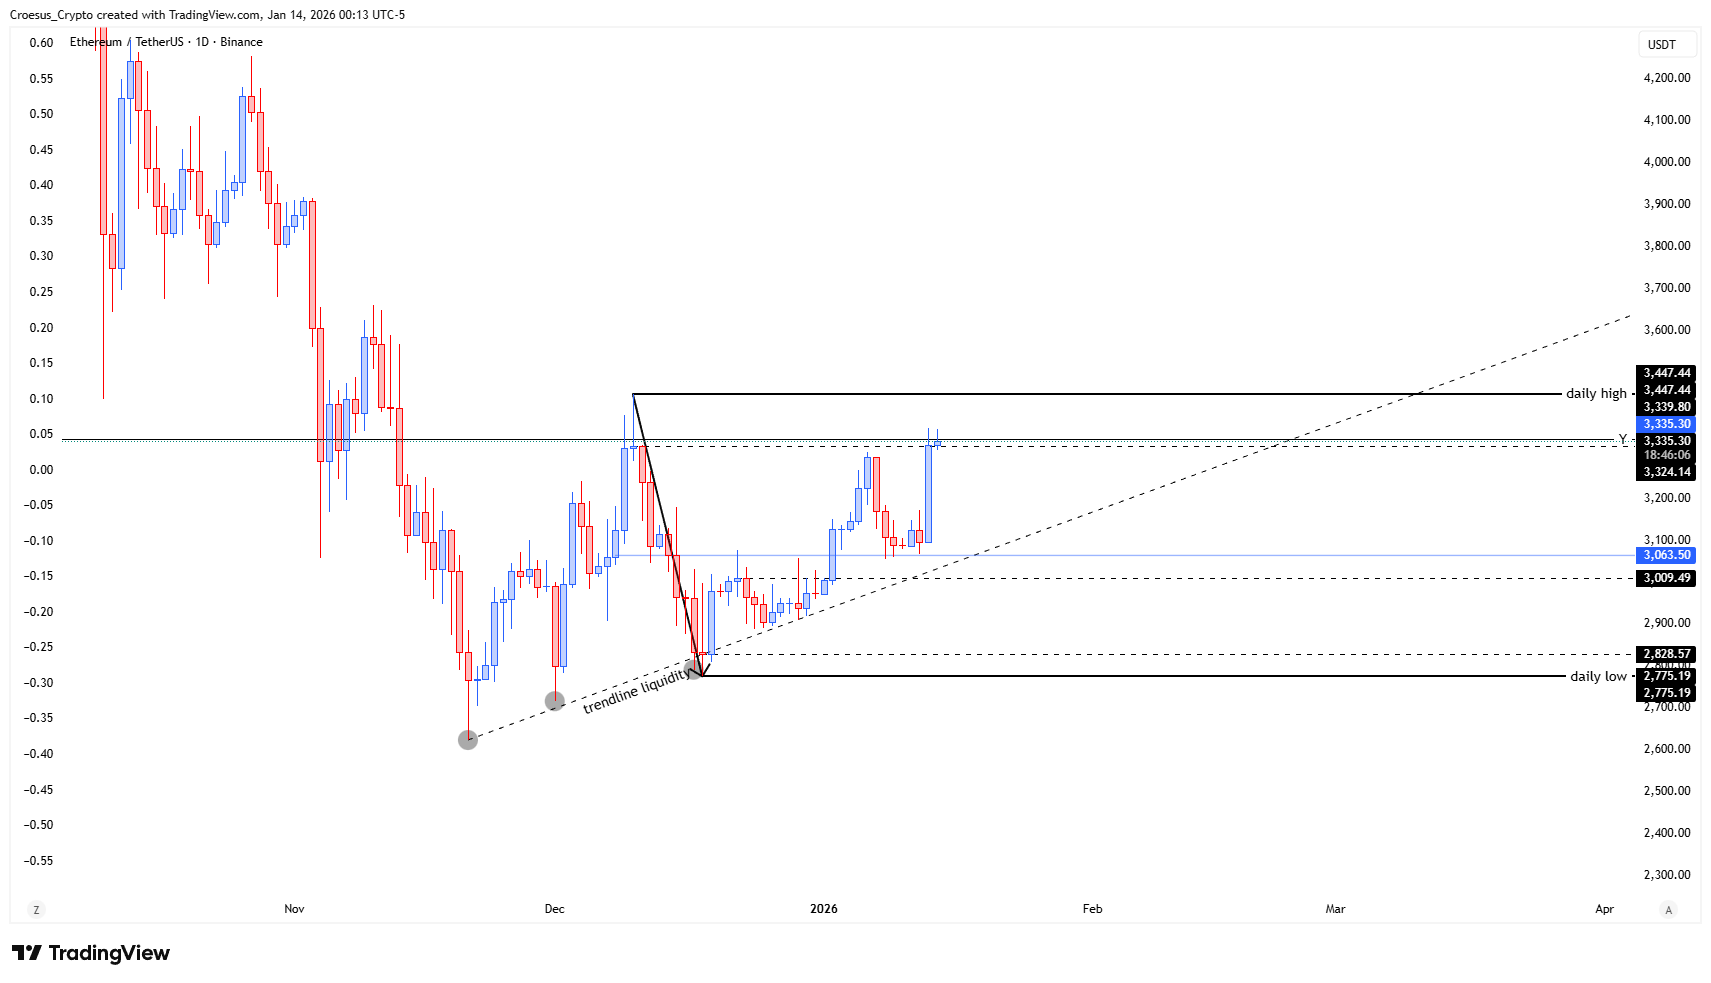
Ethereum daily chart 14 January 2026 with retest of Yearly level, Fibonacci -0.27 completion and rising trendline support.
Technical Analysis Key Points
- Price retested the Yearly level and activated the fib -0.27 completion.
- We did not break the daily high yet, so price is still range bound.
- Some relief is to be expected.
Market Structure Analysis
This Ethereum daily analysis highlights how price has respected the Yearly resistance, where the Fibonacci -0.27 completion aligns with a previous structural high. That confluence creates a strong resistance zone and explains the current hesitation after an impulsive move up from the trendline liquidity sweep.
Because the daily high has not yet been broken, ETH remains confined within its established range. The recent wick into the Yearly level looks more like a probe for liquidity than a confirmed breakout, increasing the probability of a corrective relief move back toward mid-range supports or the origin of the last impulsive leg. As long as the ascending trendline and prior higher lows hold, the broader structure can still support a later bullish continuation.
Key Levels and Scenarios
Bullish scenario: A decisive daily close above the current daily high and the Yearly level would invalidate the immediate relief thesis and signal a fresh impulsive leg higher, targeting the next resistance band and extended Fibonacci projections.
Key levels to watch:
Yearly level / Fib -0.27 completion – main resistance and decision point.
Daily high – range top and breakout trigger for a renewed impulse.
Mid-range support zone – first area for potential relief to stabilize.
Rising trendline from prior lows – dynamic support maintaining bullish structure.
Daily low area – broader invalidation level if relief turns into full reversal.
Trading Implications
Traders may prefer to wait for a relief move away from the Yearly resistance and look for confirmation of support holding before committing, with tight risk management and clear invalidation below key structural levels.
This content is for educational purposes only and is not financial advice or a recommendation to buy or sell any asset.