


In this ETH daily analysis for 15 December 2025, we are in a critical phase where monthly, weekly and daily price action start to align on a potential bearish continuation. After an initial attempt to push higher, bears have stepped back in around weekly supply, and our technical analysis now focuses on how price behaves between that resistance and the demand zone near the monthly shoulder.
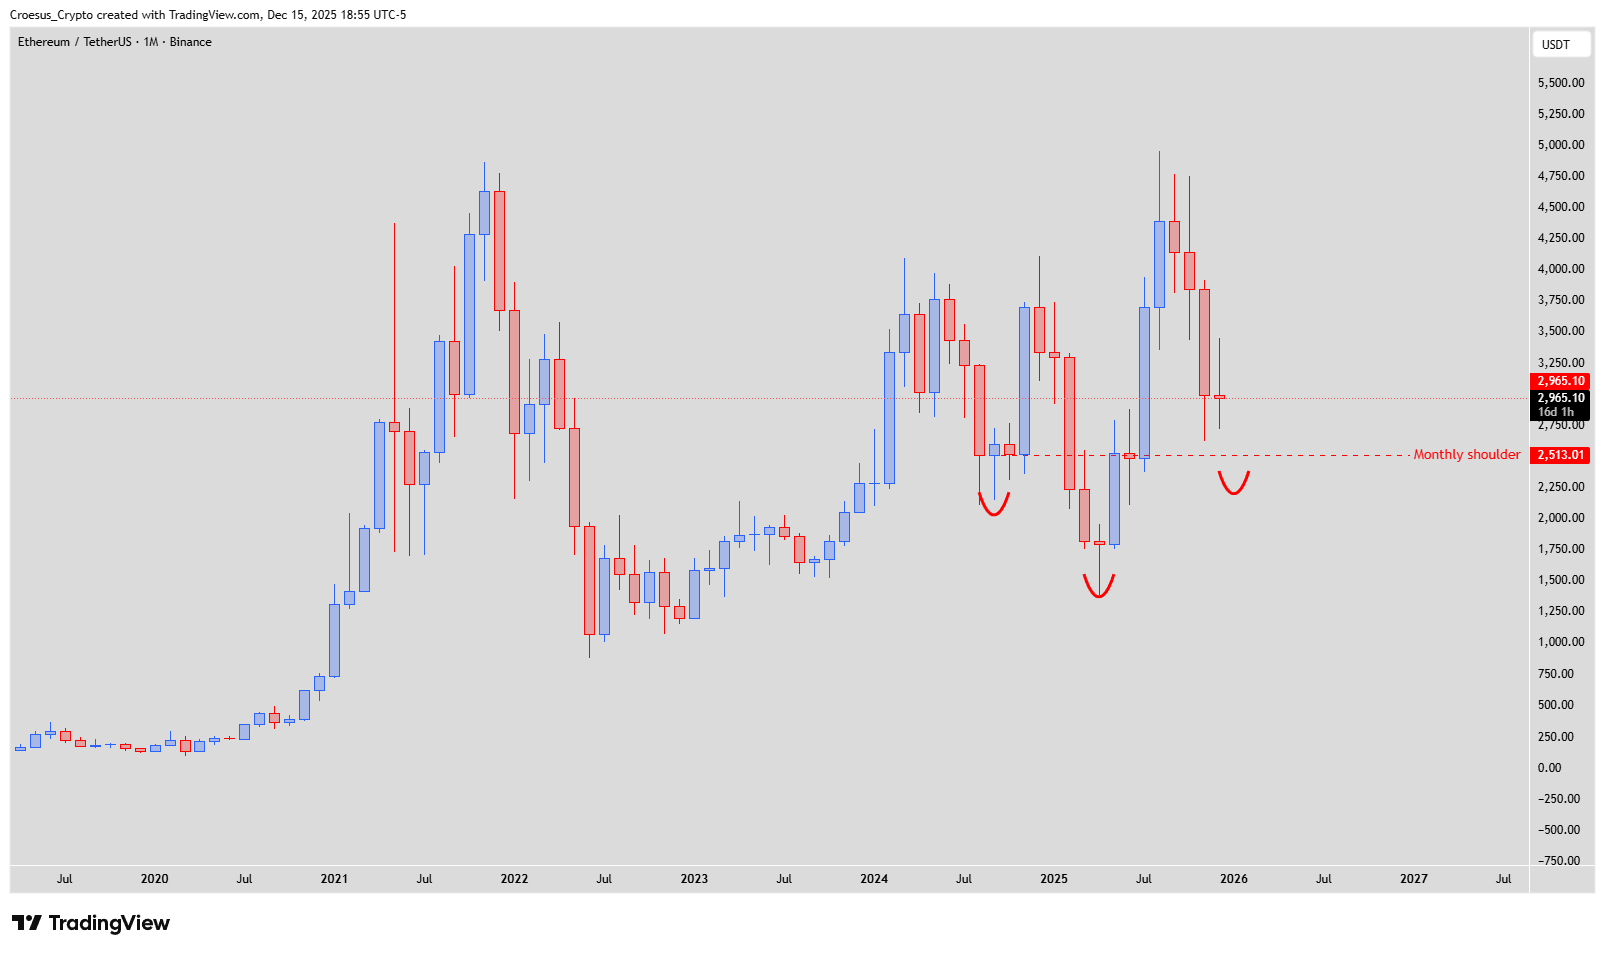
Ethereum monthly chart Dec 15 2025 with fair value gap fill and inverse head and shoulders around monthly shoulder at $2,513.01
Technical Analysis Key Points
- We are in a critical phase, so we would like to clarify the next movement of ETH in a topdown analysis.
- On the monthly chart, we can see the price tried to push higher, closing the fair value gap, but is now back at the candle open level. This indicates that the bears pushed the price back down after the initial bullish attempt. The monthly shoulder level and even the head level can act as magnets, because this is a strong level of liquidity.
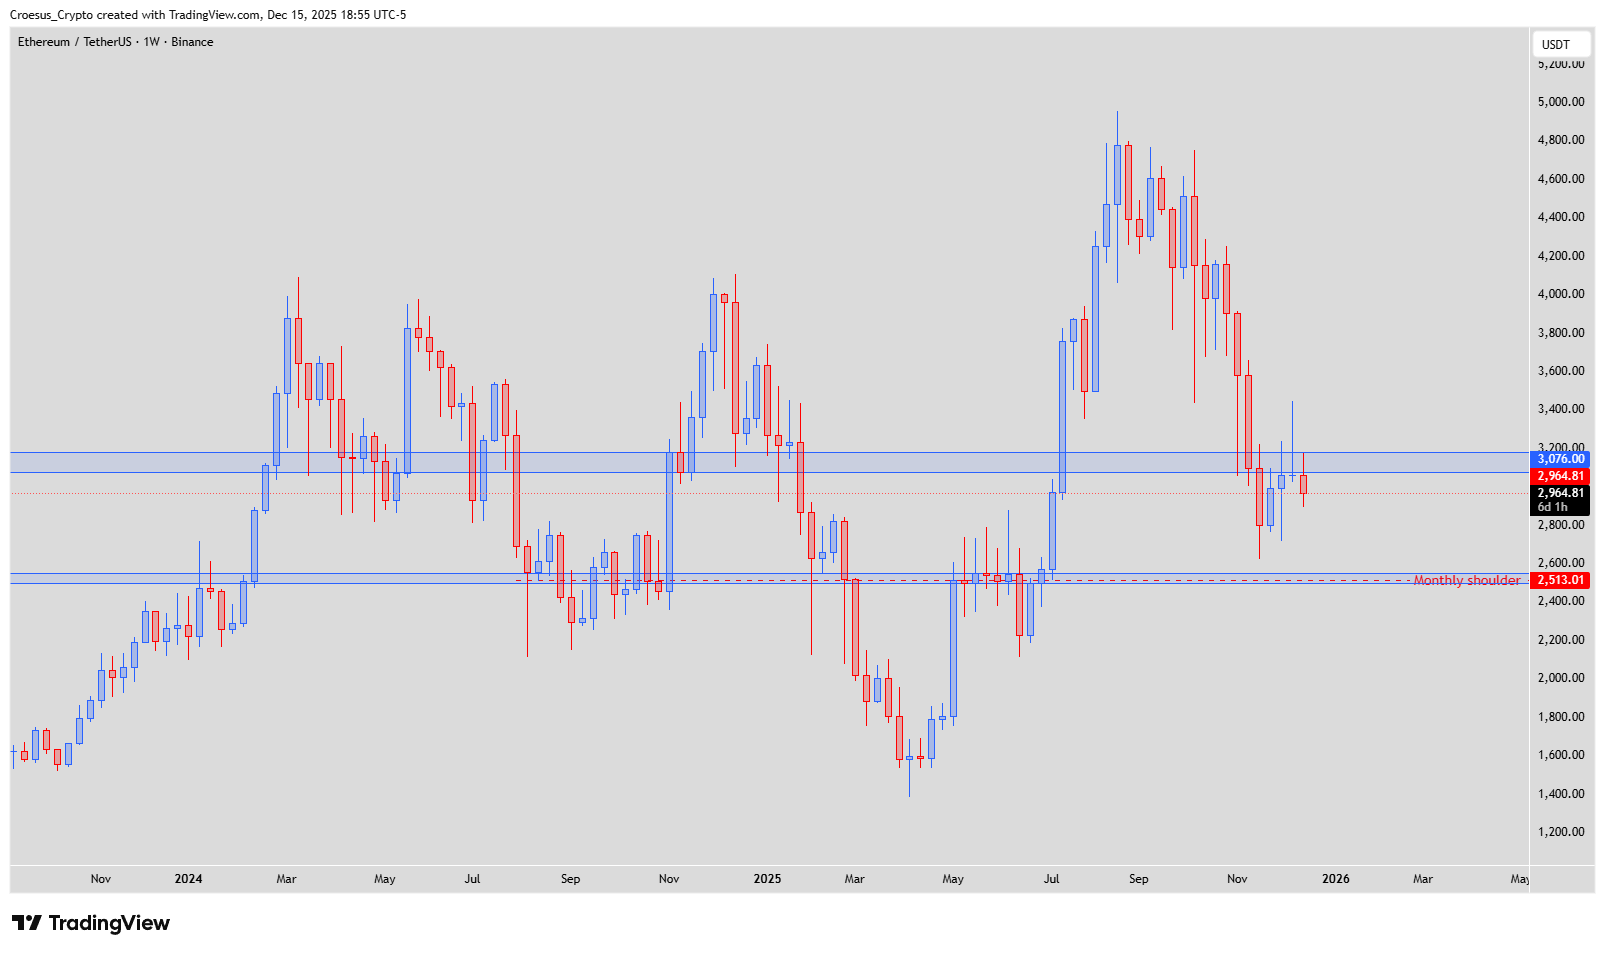
- On the weekly chart, last week we saw clearly the price attempting to push through a weekly supply level. But the weekly candle ended with a swing failure, indicating clearly that bears are back in power. Mostly there will be a bearish continuation towards the demand zone around $2.500.
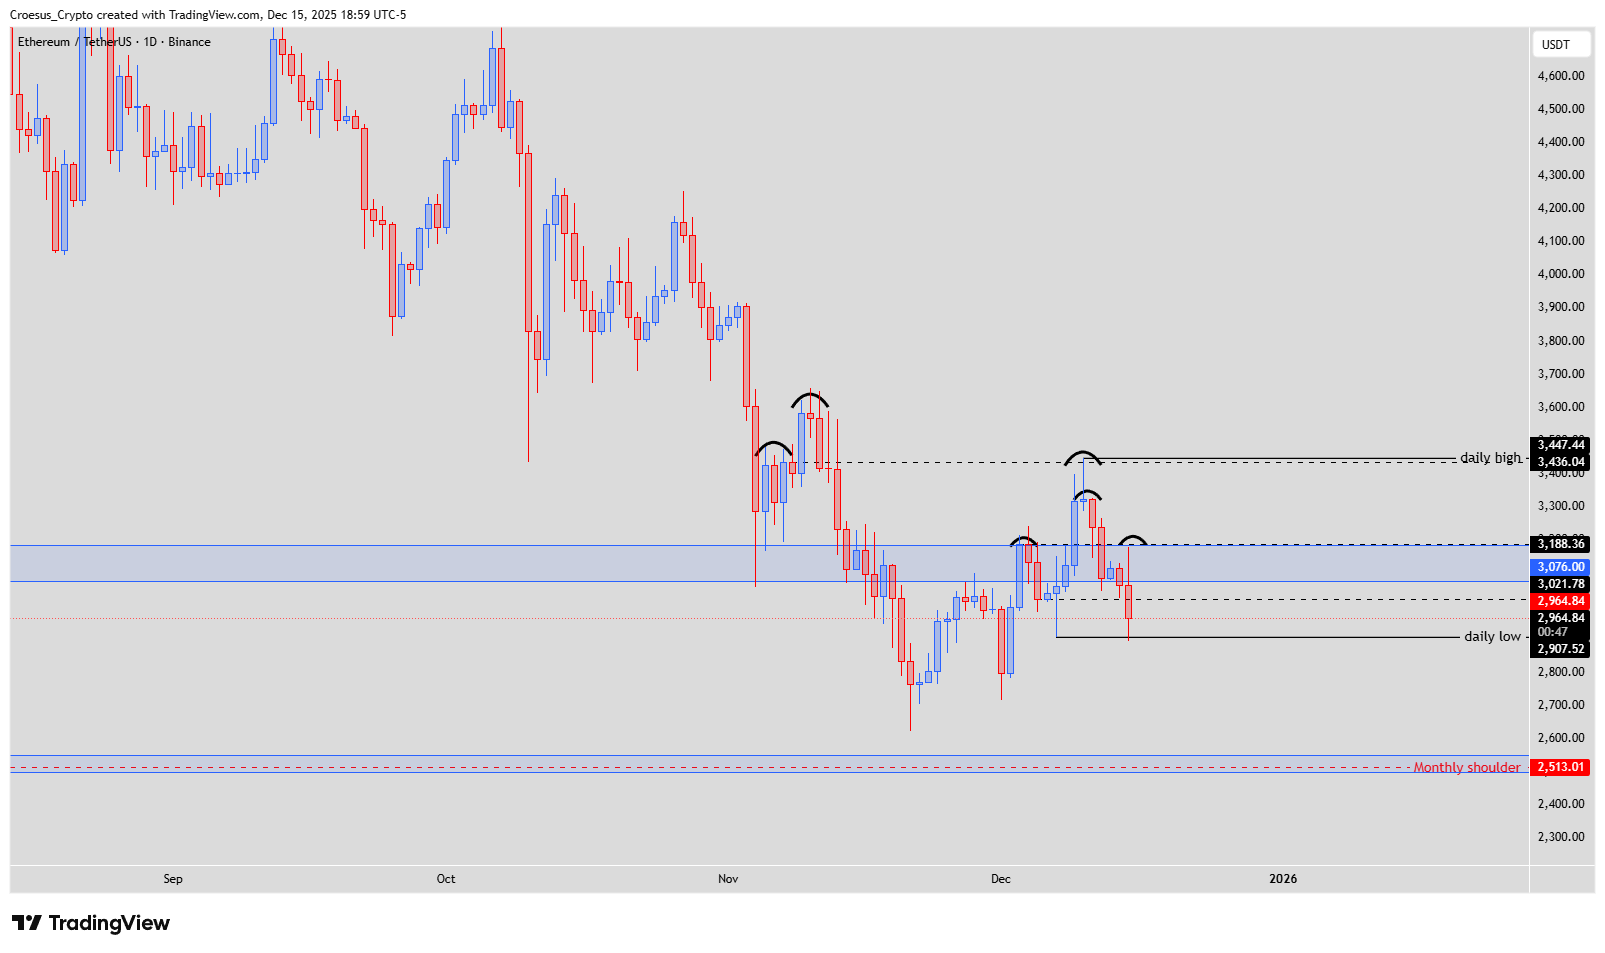
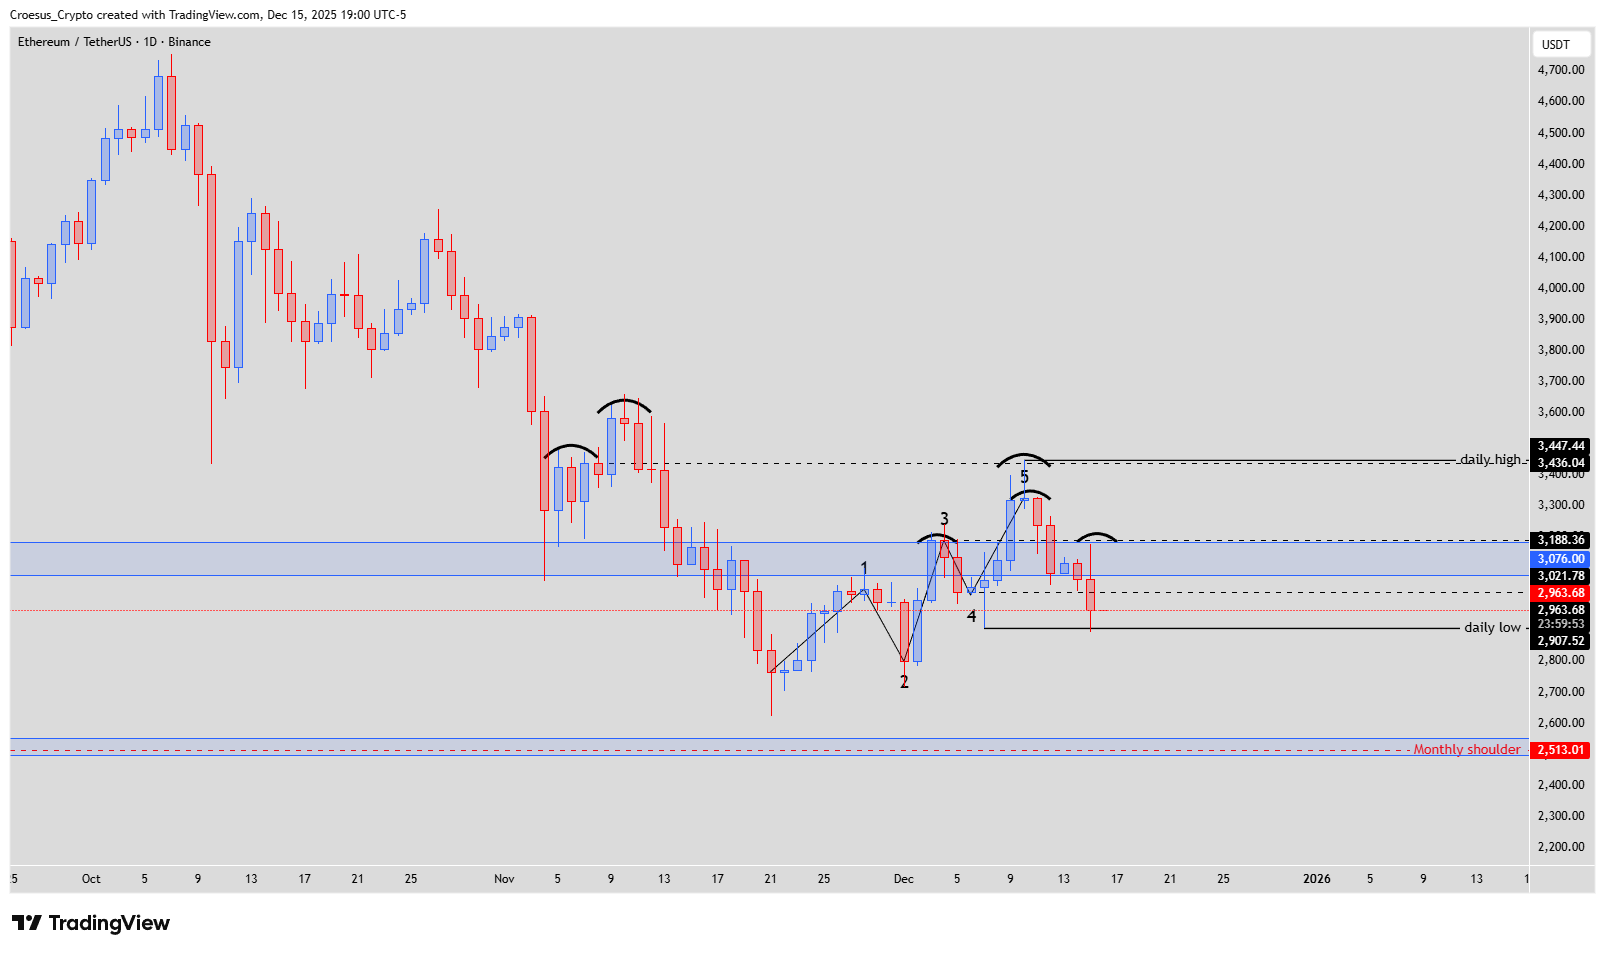
- On the daily, we saw the price attempting to push higher, through the weekly zone, until a shoulder level @ $3.436,04. We can also see the impulsive Elliottwave (12345) being finalized with the swing high. Afterwards the price fell back down the weekly supply zone. Eventhough the price has not broken the daily bullish trend yet, we can assume or expect a head and shoulders (with or without a double top - correction towards 3 or 5). But followed by a bearish continuation.
Market Structure Analysis
Top-down, this ETH daily analysis shows a market testing the upper range and failing.
On the monthly chart, rejection back to the candle open after closing the fair value gap confirms strong supply above and turns the monthly shoulder and head levels into liquidity magnets. That shoulder near $2,513.01 is a key structural support where long-term buyers may re-enter.
On the weekly timeframe, the swing failure at weekly supply underscores that resistance and supports the idea of a move toward the demand zone around $2,500. This aligns with the broader support resistance map and keeps bears in control.
On the daily chart, price completed an impulsive Elliott wave 1–5 into $3,436.04, then sharply rejected back into the weekly zone. While the strict daily bullish trendline is not yet broken, the developing head and shoulders (potentially with a double top) flags distribution rather than accumulation, pointing to a likely bearish continuation once the neckline gives way.
We deliberately prioritise price action and support resistance here and hold off on detailed Fibonacci projections until the daily structure confirms.
Key Levels and Scenarios
Bullish scenario (corrective): A short-term push back from current levels into the shoulder region near $3,436.04 would fit a corrective bounce inside a topping structure, only turning genuinely bullish if ETH can reclaim and hold above weekly supply.
Key levels to watch:
$3,436.04 shoulder / daily swing high: Key resistance and completion point of the Elliott wave structure.
Weekly supply zone: Main resistance area that rejected price and defines the upper boundary of the current range.
Daily neckline of potential H&S: Breakdown level that would confirm bearish continuation on the daily chart.
Demand zone around $2,500: Primary downside target from weekly structure.
Monthly shoulder near $2,513.01 and head level below: Deep liquidity zone and potential higher-timeframe reversal area if reached.
Trading Implications
For traders, the current setup favors a cautious bearish bias: short opportunities are more attractive on bounces toward the daily shoulder or weekly supply, while potential long scenarios become interesting only closer to the $2,500–monthly shoulder area with clear confirmation, using conservative position sizing and defined invalidation levels.
This content is for educational purposes only and is not financial advice or a recommendation to buy or sell any asset.