


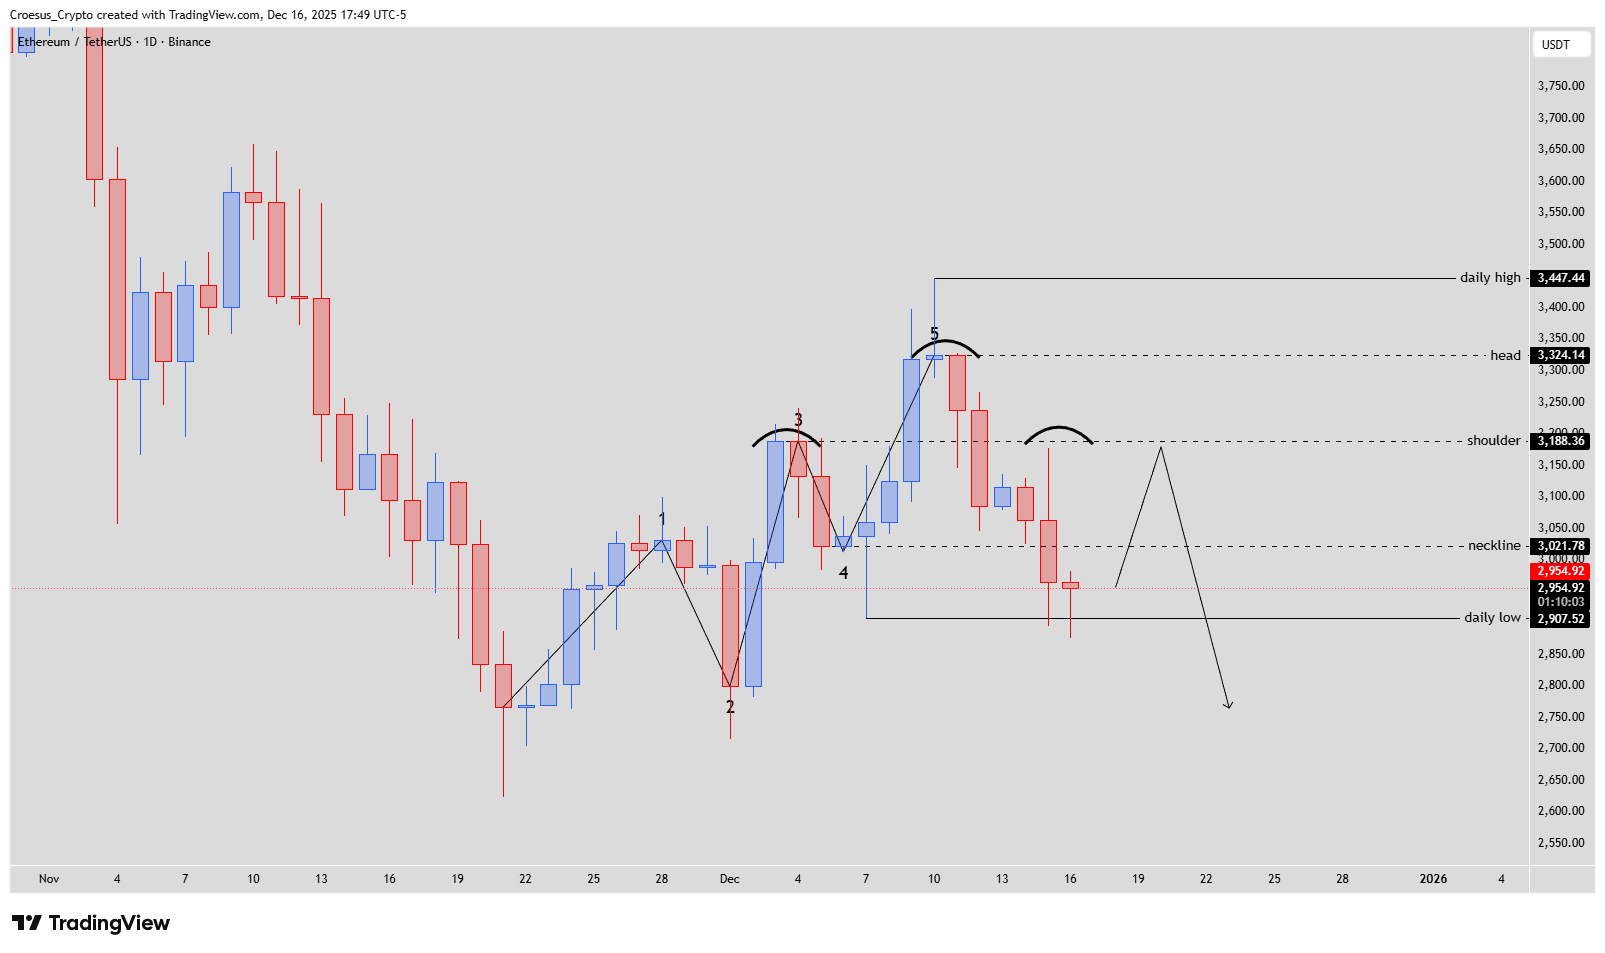
In this Ethereum daily analysis we focus on the completed bullish Elliott 1–5 impulse and the early signs of a corrective structure forming inside the current daily range. Price action remains technically bullish for now, with the most recent pullback holding above the daily low support while a head and shoulders risk builds around the mid-$3,000 area in our technical analysis framework.
Ethereum monthly chart Dec 15 2025 with fair value gap fill and inverse head and shoulders around monthly shoulder at $2,513.01
Technical Analysis Key Points
- a bullish Elliott impulse (12345) was completed. We could see a correction now
- at this moment still bullish. The daily low acts as a support.
- but within the daily range a head and shoulders could be formatting. Watch closely when the price hits the shoulderlevel @$3.188,36
- Resistance @ the shoulderlevel would mean bearish continuation
Market Structure Analysis
The chart shows a clean bullish Elliott impulse (1–5) that carried ETH from late-November lows into the recent high around the head region near $3,324.14. This five-wave structure typically precedes a corrective phase, so we now expect the next leg to be more sideways or counter-trend rather than impulsive.
Despite the current pullback, structure remains bullish as long as the daily low around $2,907.52 holds, acting as key support within the range. Inside this box, price is starting to trace out a potential head and shoulders pattern: left shoulder at prior local high, head at the recent peak, and a possible right shoulder projected into the $3,188.36 “shoulderlevel”. This level aligns with clear horizontal support resistance and becomes the critical decision point. A rejection there would confirm that the recent bounce is corrective rather than the start of a fresh impulse.
Key Levels and Scenarios
Bullish scenario (correction only):
If ETH can reclaim and hold above the neckline near $3,021.78 and then break through $3,188.36, the head and shoulders idea weakens and price could revisit the head zone around $3,324.14 or even the daily high near $3,447.44 as part of a continued uptrend.
Key levels to watch
$3,447.44 – Daily high: major resistance and upside target if trend resumes
$3,324.14 – Head: last swing high, strong resistance
$3,188.36 – Shoulderlevel: pivotal resistance; rejection here favours bearish continuation
$3,021.78 – Neckline: mid-range level; loss on a daily close strengthens the topping pattern
$2,907.52 – Daily low: main downside support; break opens room for a deeper corrective move
Trading Implications
For now, we treat ETH as bullish but vulnerable: the completed 1–5 impulse suggests a correction, yet the daily low still protects the trend. Traders may look for reaction and confirmation signals around $3,188.36, using support resistance and, if desired, Fibonacci tools to refine entries, stops and profit targets.
This content is for educational purposes only and is not financial advice or a recommendation to buy or sell any asset.