ETH Marketcap / Ethereum
ETH daily analysis 16/03/2026. Ethereum is pushing with a strong upside leg into the daily highs, but our higher-level read remains bearish until price proves acceptance above this key resistance area.
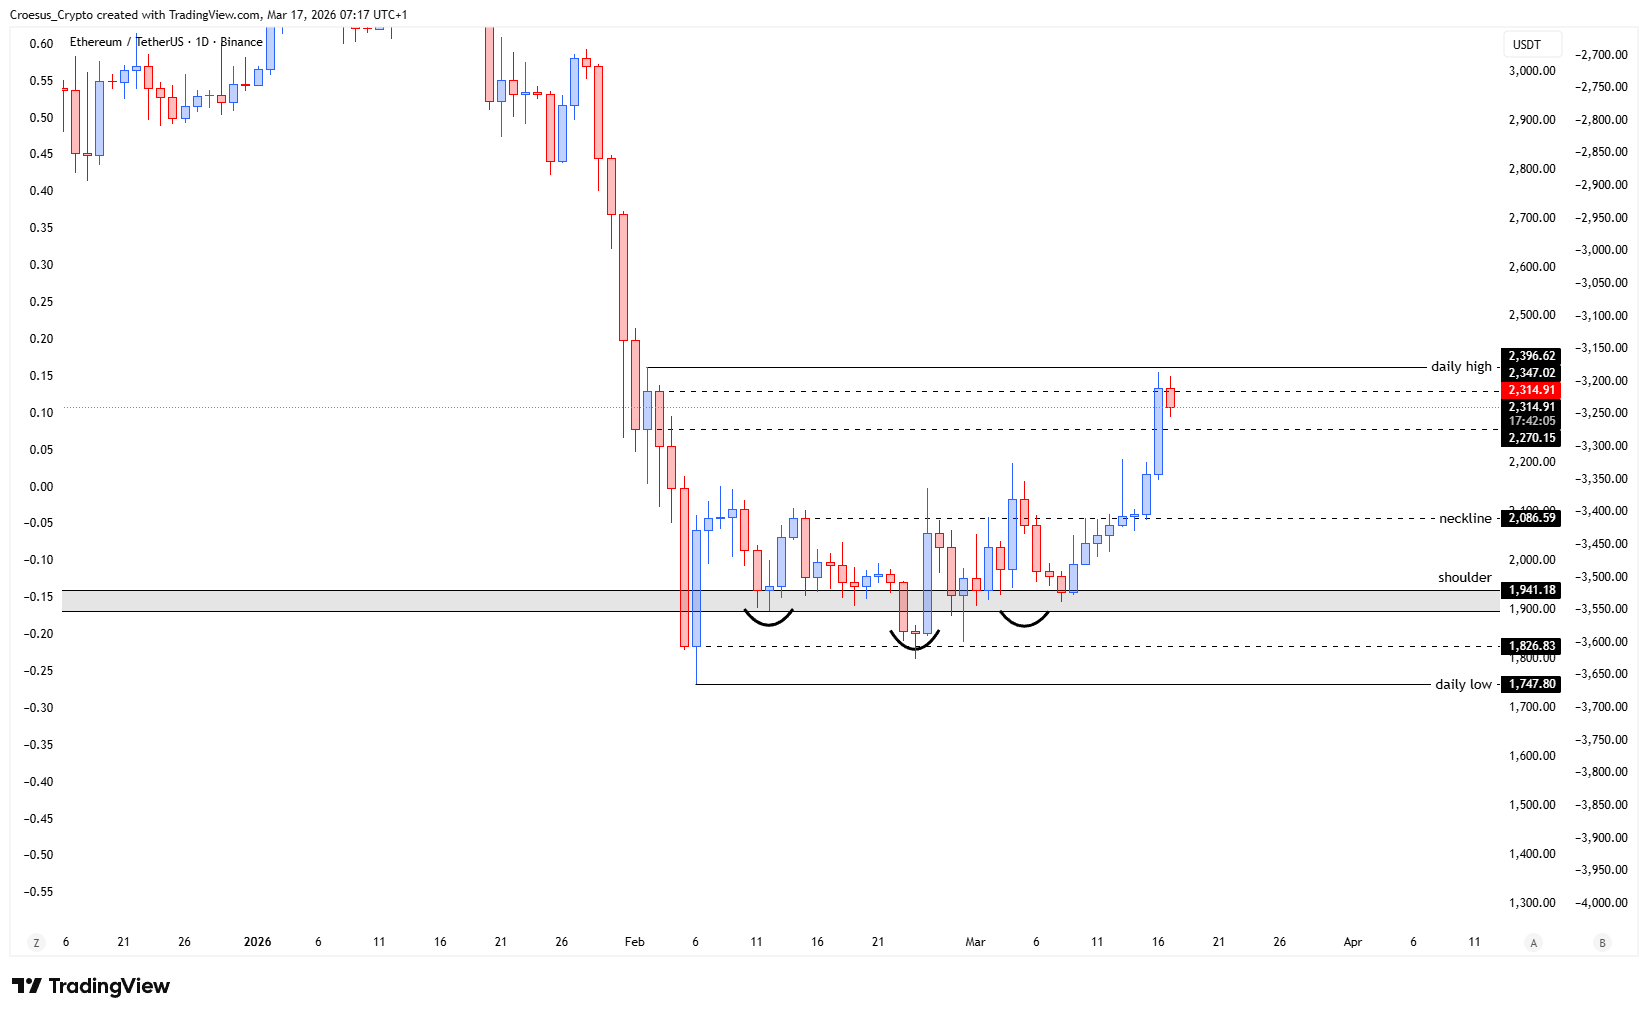
- The ETH price shows us a clear bullish continuation into the daily highs.
- Will this daily high level act as resistance and do we see a rejection at the high and a relief ? Or do we see a clear break and retest of this level ?
Market Structure Analysis
From a naked trading perspective, this ETH daily analysis is centred on how price behaves at the “daily high level” after a bullish continuation push.
In a bearish context, this type of upside drive often functions as a corrective move into a supply zone (previous swing high / range high), where sellers can defend structure and force a rotation lower. That is why the daily high is a clean, decision-point resistance: it is where we expect either (1) rejection and a relief move as price fails to accept higher, or (2) a break of structure followed by a retest that flips prior resistance into support resistance dynamics in favour of bulls.
The key confirmation is not the spike into the high itself, but whether price can hold above that level on a retest. A rejection tends to show up as failure to build above the high and a rotation back into the prior range, while a bullish break-and-retest scenario requires acceptance above the daily high and continuation from that reclaimed level.
Key Levels and Scenarios
ETH daily analysis scenarios remain binary around the daily high. If the level caps price, the bearish trend context stays in control and a relief pullback becomes the higher-probability path. If price breaks and retests the daily high successfully, bearish pressure weakens and the move can transition from corrective into a new impulse.
- Daily high level: primary resistance and decision point for rejection vs acceptance
- Break-and-retest zone above the daily high: required for confirmation of bullish continuation
- Prior consolidation/range area below the high: first area to watch for a relief rotation
- Most recent swing low on the daily leg: structural invalidation area for the immediate bullish push
Trading Implications
Risk is elevated at the daily high because both outcomes are plausible and volatility typically increases at major horizontal levels. Conservative traders generally wait for a clear break and retest (acceptance) or a clean rejection (failure) before assigning directional bias, while aggressive traders may trade the reaction but should respect that this is a high-impact inflection zone in the broader bearish structure.
This analysis is for informational purposes only and does not constitute financial advice.