ETH Marketcap / Ethereum
ETH daily analysis 18/03/2026. Ethereum is testing daily highs, but our technical analysis shows sellers actively defending that area, creating a near-term bearish tone while price remains capped under resistance.
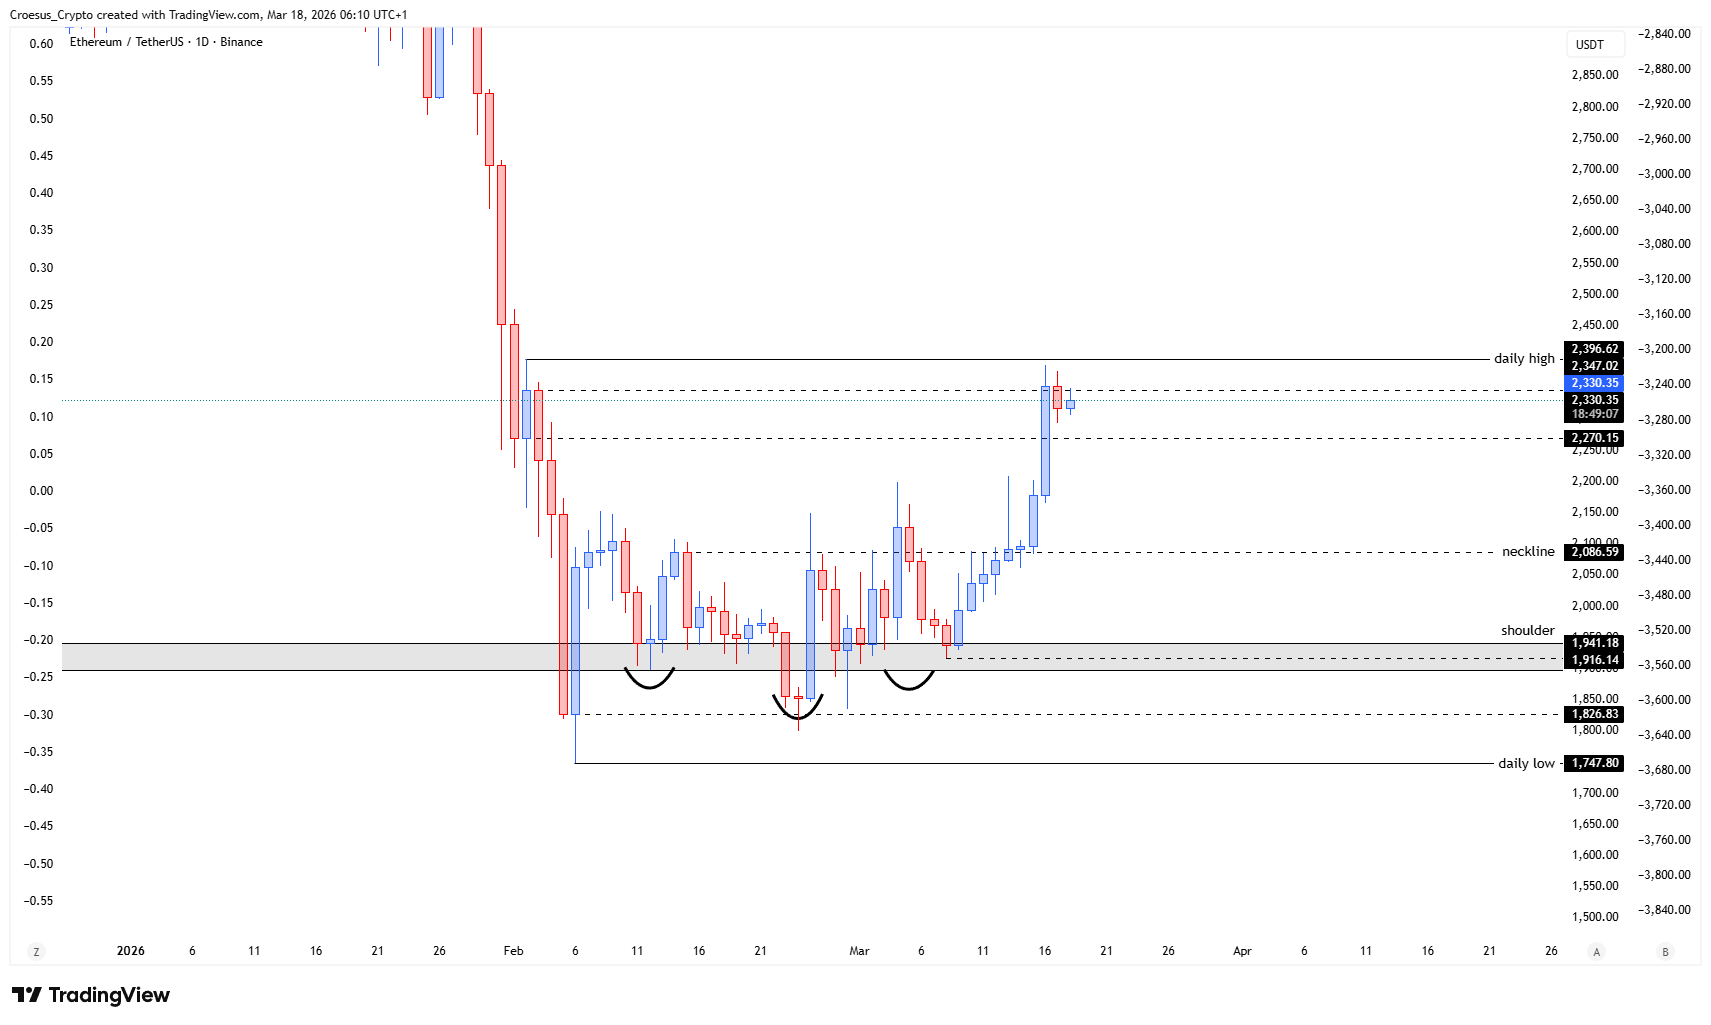
- The ETH price shows us that it pushed until the daily highs but bears are defending that level and printed a first bearish indicational candle.
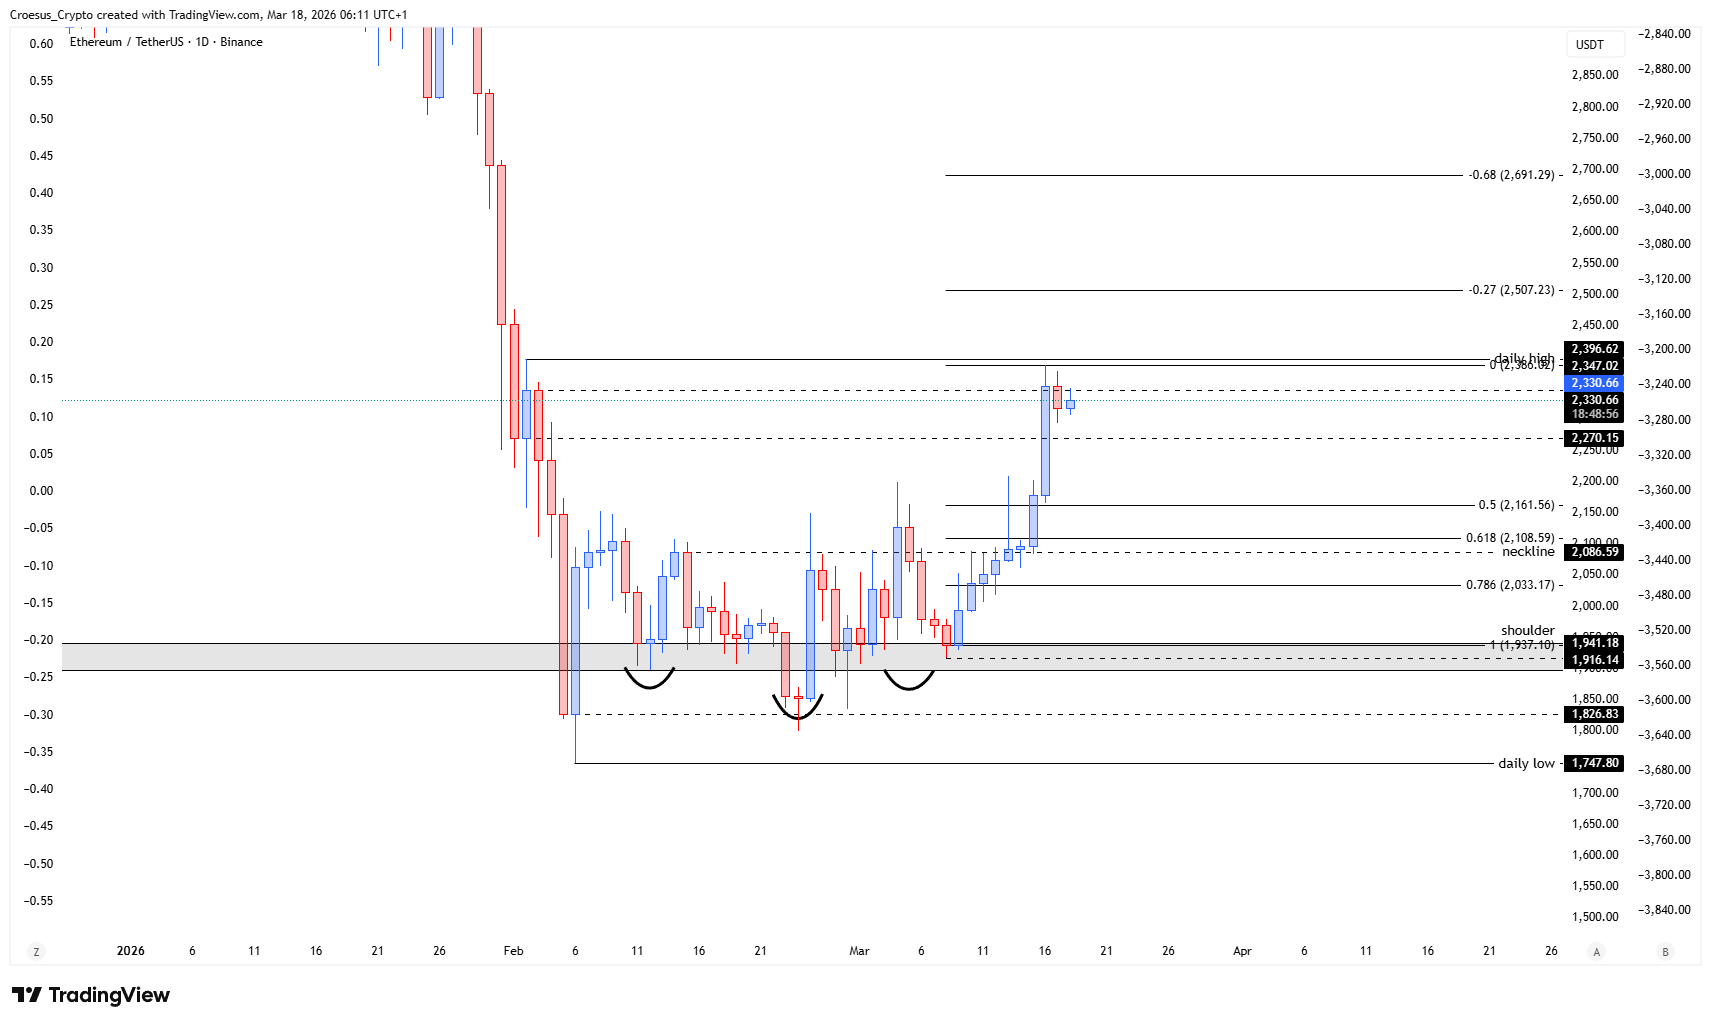
- If we pull the Fibonacci retracement from the bullish leg, we can that a pullback might find support on the neckline. If the expansion takes place we could see the price expanding beyond the daily high.
Market Structure Analysis
From a market structure perspective, ETH is currently reacting at a clear horizontal resistance zone defined by the daily highs. The fact that price pushed into that area but then printed a first bearish indicational candle suggests supply is absorbing demand at the range high, which often precedes a corrective move back into prior structure. At the same time, the presence of a bullish leg in your Fibonacci context keeps the broader structure conditional: a pullback can remain corrective (rather than a full reversal) if it holds at the neckline area. This neckline functions as a key support resistance flip zone—if buyers defend it, ETH can rebuild the base for another attempt at the highs. If that level fails, the rejection at the highs gains more weight and downside continuation becomes the higher-probability path.
Key Levels and Scenarios
For bearish continuation, ETH needs to keep rejecting from the daily highs and accept below near-term support, turning the latest push into a failed expansion. For a bullish reclaim, price must hold the neckline during any pullback and then break and accept above the daily high to confirm expansion.
- Daily highs: primary resistance where bears are currently defending
- Neckline: structural support zone where a pullback “might find support”
- Fibonacci retracement zone of the bullish leg: area to gauge whether the move is corrective or breaking down
- Daily high breakout/acceptance: trigger condition for upside expansion beyond the highs
Trading Implications
In this ETH daily analysis, the cleanest read is to treat the daily highs as the decision point and the neckline as the key demand test. Aggressive traders typically focus on reaction quality at these horizontal levels, while conservative traders generally wait for acceptance (break-and-hold) either back above the highs or below support before committing to directional bias.
This analysis is for informational purposes only and does not constitute financial advice.