


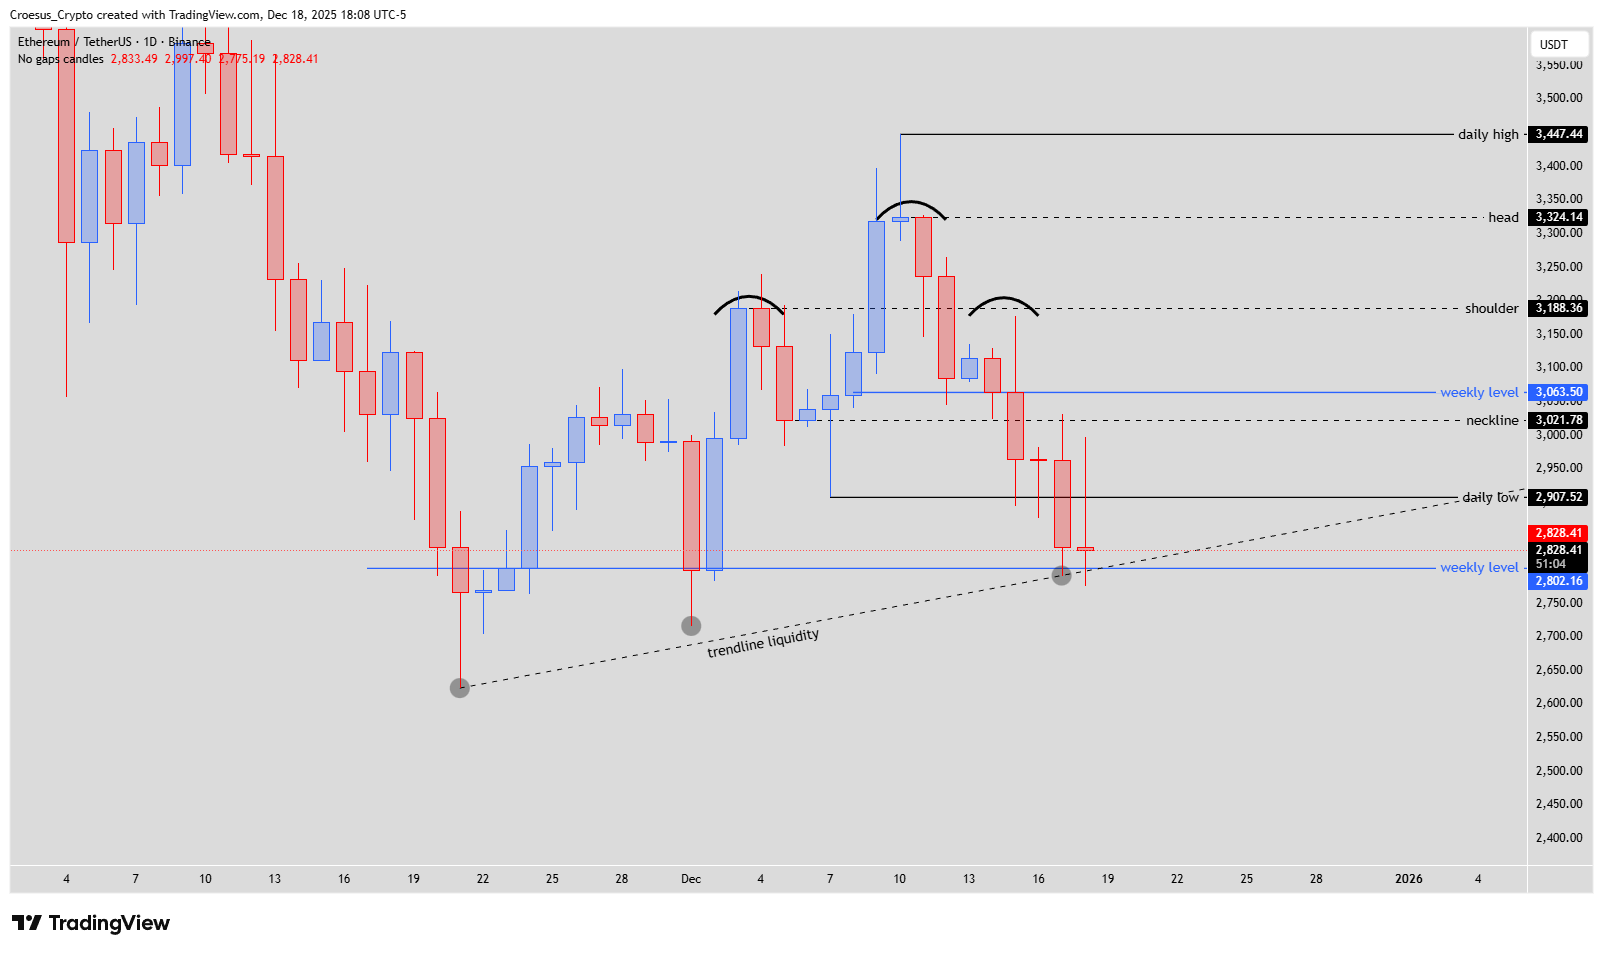
In this Ethereum daily analysis for 18 December 2025, we see ETH testing a critical confluence of support after breaking the prior daily low. Our technical analysis focuses on the interaction between the weekly level around 2,800, the rising trendline liquidity, and the local head and shoulders structure with clear support resistance zones.
Ethereum daily chart 18 Dec 2025 with head and shoulders structure, weekly levels, daily low break and rising trendline support
Technical Analysis Key Points
- Yesterday the price broke the daily low, giving us a first break of that level and a retest of the weekly level
- Today the price was very volatile: early in the session it rose to retest the broken daily low, then was rejected around New York noon, and the NY session closed with a bearish gravestone doji (small body with a long upper wick), indicating that further downside could be expected.
- At the moment, the trendline still holds as support, as does the weekly level.
Market Structure Analysis
ETH has printed a first clean break of the recent daily low near 2,907, immediately tagging the weekly level around 2,802 and tapping liquidity along the rising trendline.
Today’s intraday move retested the broken daily low from below before sellers stepped back in at New York noon, leaving a gravestone doji – a classic sign of strong supply at higher prices and potential continuation to the downside.
As long as candles close below the reclaimed daily low, the bias remains cautious to bearish, even though both the weekly level and trendline are still acting as support. A sustained close back above 2,907 would ease immediate downside pressure and reopen a path toward the neckline and shoulder region above 3,020–3,180.
Key Levels and Scenarios
Bullish scenario: buyers must defend the weekly level (~2,800) and trendline, then reclaim the daily low at 2,907, targeting the neckline (~3,020) and eventually the shoulder area (~3,188) if momentum improves.
Key levels to watch:
3,447 – daily high and major resistance
3,188 – shoulder area; first strong supply zone
3,021 – neckline; important resistance pivot
2,907 – broken daily low; must be reclaimed for upside
2,802 – weekly level and trendline confluence; key support
Trading Implications
As long as ETH trades below the broken daily low, traders may favor defensive positioning or short setups, using the weekly level and trendline as clear invalidation areas and sizing positions conservatively.
This content is for educational purposes only and is not financial advice or a recommendation to buy or sell any asset.