ETH Marketcap / Ethereum
ETH daily analysis 18/03/2026. Ethereum is trading in a bearish context after price reacted at the daily high, and our technical analysis focuses on whether this move develops into continuation lower or turns into a deeper pullback supported by structure and Fibonacci.
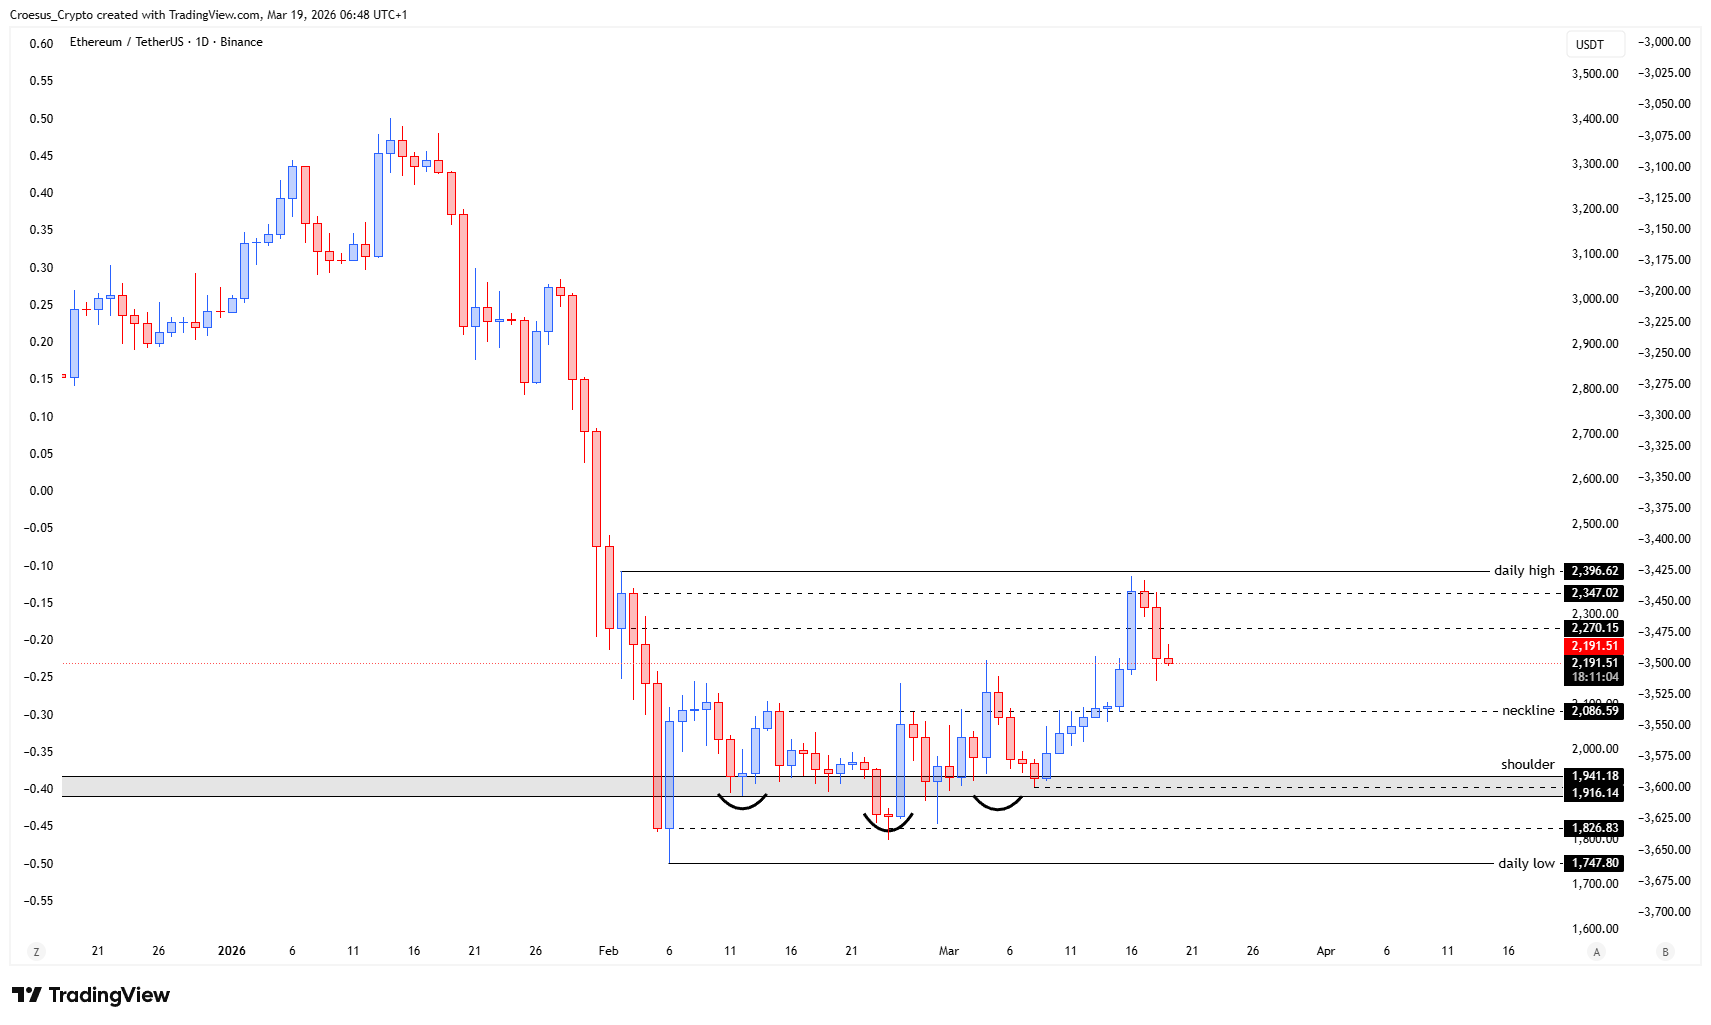
- The ETH price shows us that price was stopped at the daily high, showed us an indicational candle and confirmed today the bearish relief
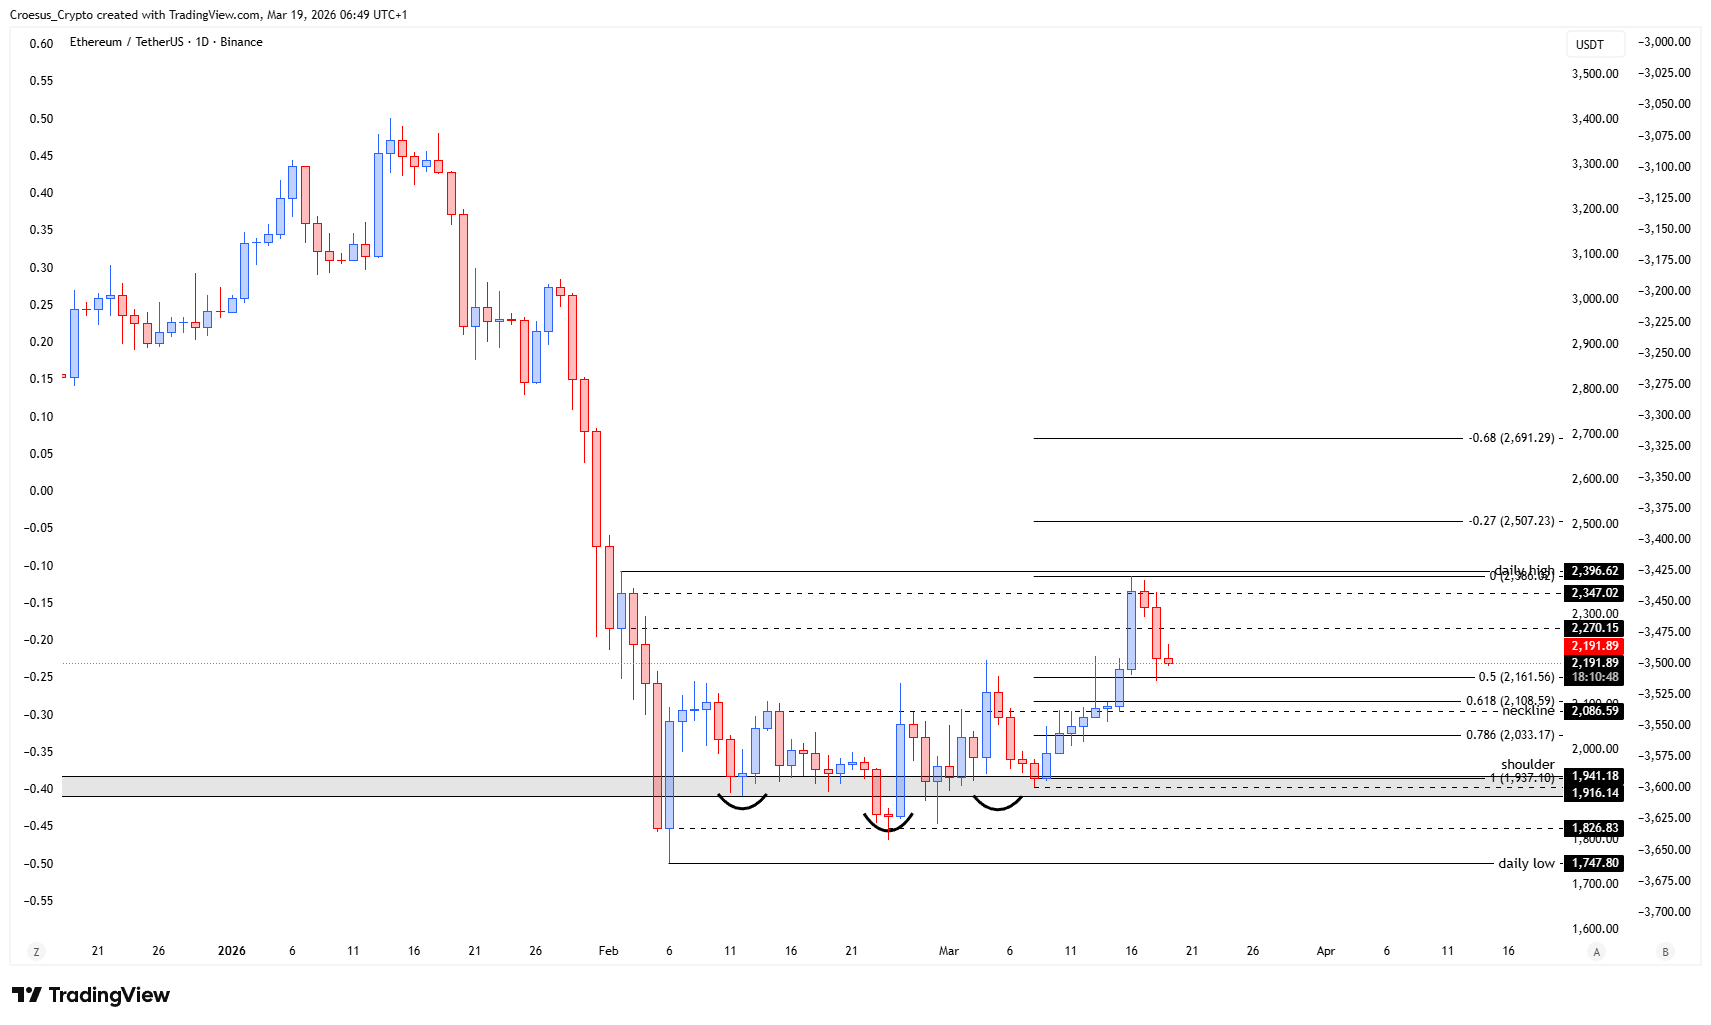
- If we pull the Fibonacci retracement from the bullish leg, we can that a pullback might find support on the neckline. If the expansion takes place we could see the price expanding beyond the daily high.
- Price approaches the golden pocket zone between 0.618 and 0.786.
Market Structure Analysis
From a naked trading perspective, ETH is currently defined by a clear reaction at the daily high, where the market printed an indicational candle and then confirmed bearish relief today.
Structurally, that keeps the daily high as the immediate reference resistance, while the market shifts attention toward the prior bullish leg that is now being retraced. With Fibonacci pulled from that bullish impulse, the “golden pocket” (0.618–0.786) becomes a key decision zone where corrective pullbacks often stabilize or accelerate.
The neckline mentioned in our ETH daily analysis acts as a horizontal support resistance pivot: holding it supports a controlled corrective structure, while losing it suggests sellers are regaining control and extending the bearish leg.
Key Levels and Scenarios
In this ETH daily analysis, the bearish scenario remains in play as long as price continues to respect the daily high as resistance and fails to reclaim it with acceptance. A stabilizing scenario requires buyers to defend the neckline and show a reaction through the Fibonacci retracement zone; if expansion follows, price can attempt to push beyond the daily high.
- Daily high: key resistance where price was “stopped” and sellers defended
- Neckline: primary structural support level for a pullback to hold
- Fibonacci 0.618: first side of the golden pocket reaction zone
- Fibonacci 0.786: deeper golden pocket support where invalidation risk increases
Trading Implications
The current zone is structurally sensitive: aggressive traders typically focus on confirmation around the neckline and golden pocket, while conservative traders often wait for either a clean reclaim of the daily high or a clear breakdown through support. Risk remains elevated near these inflection levels because liquidity can be swept on both sides before direction resolves.
This analysis is for informational purposes only and does not constitute financial advice.