


ETH Marketcap / Ethereum
In this ETH daily analysis for 19 February 2026, Ethereum trades in a tight range after a strong impulsive drop, very similar to TOTAL and BTC. Price is compressing above a key horizontal level, with the market deciding whether this area turns into firm support or breaks to extend the move toward the daily low around 1,747.
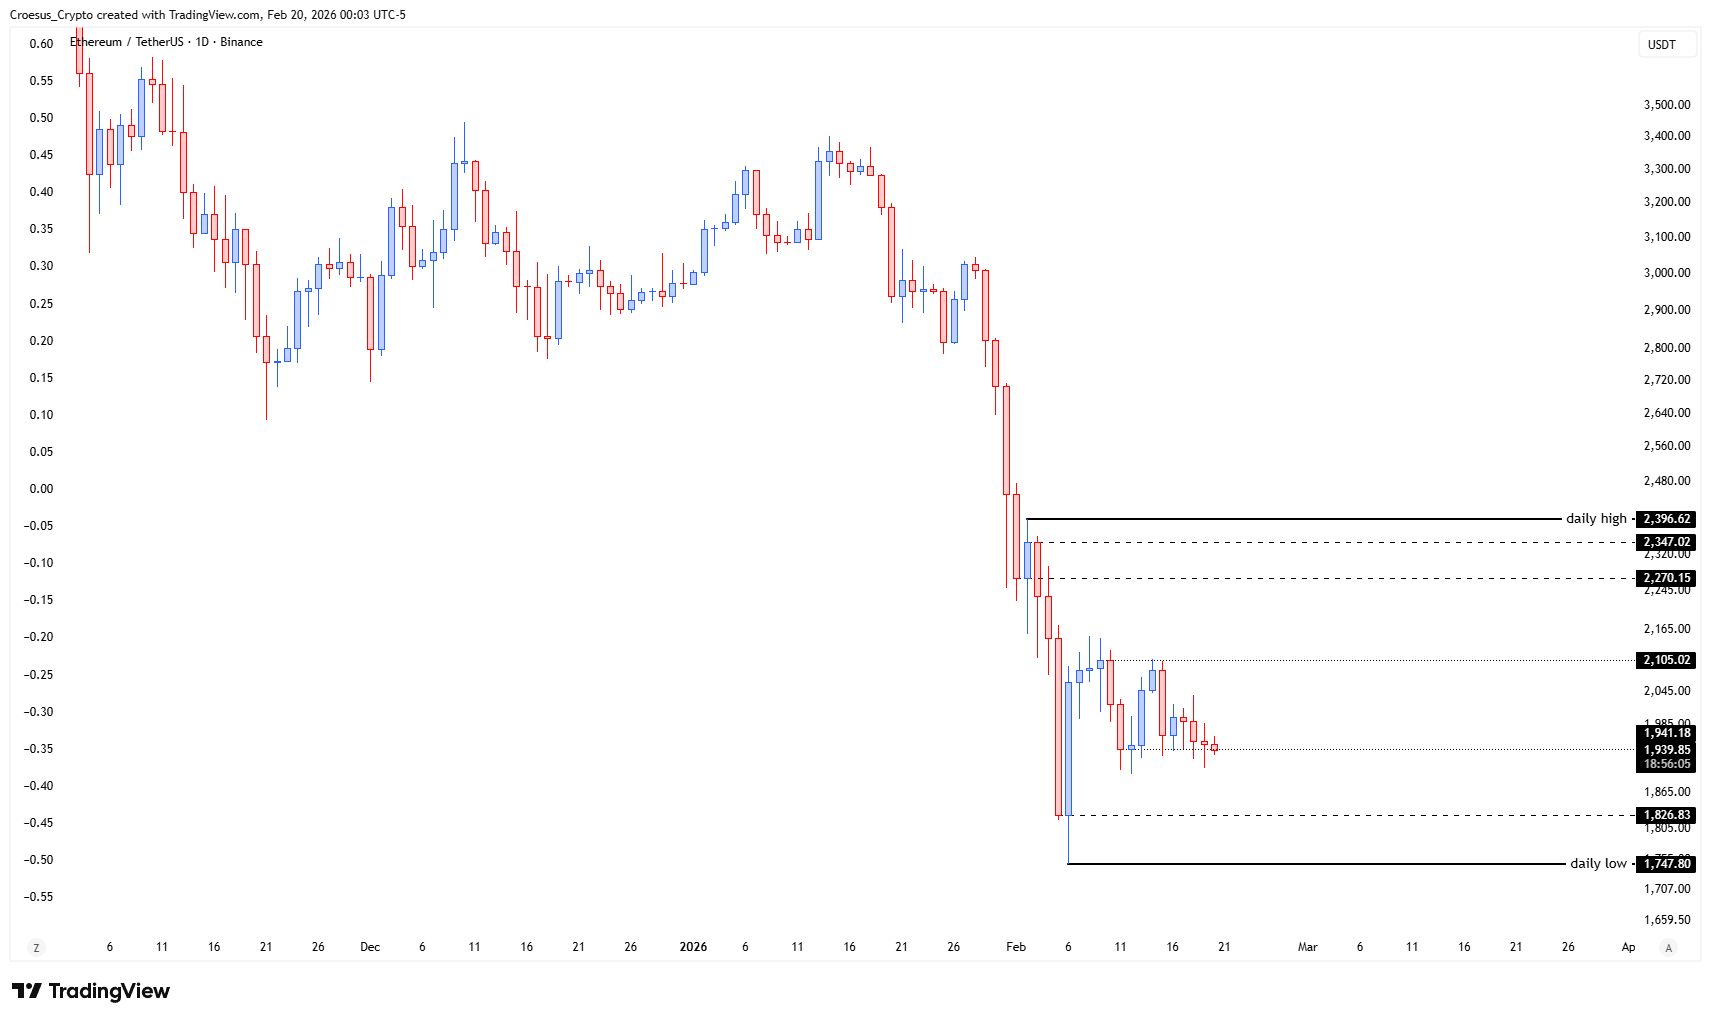
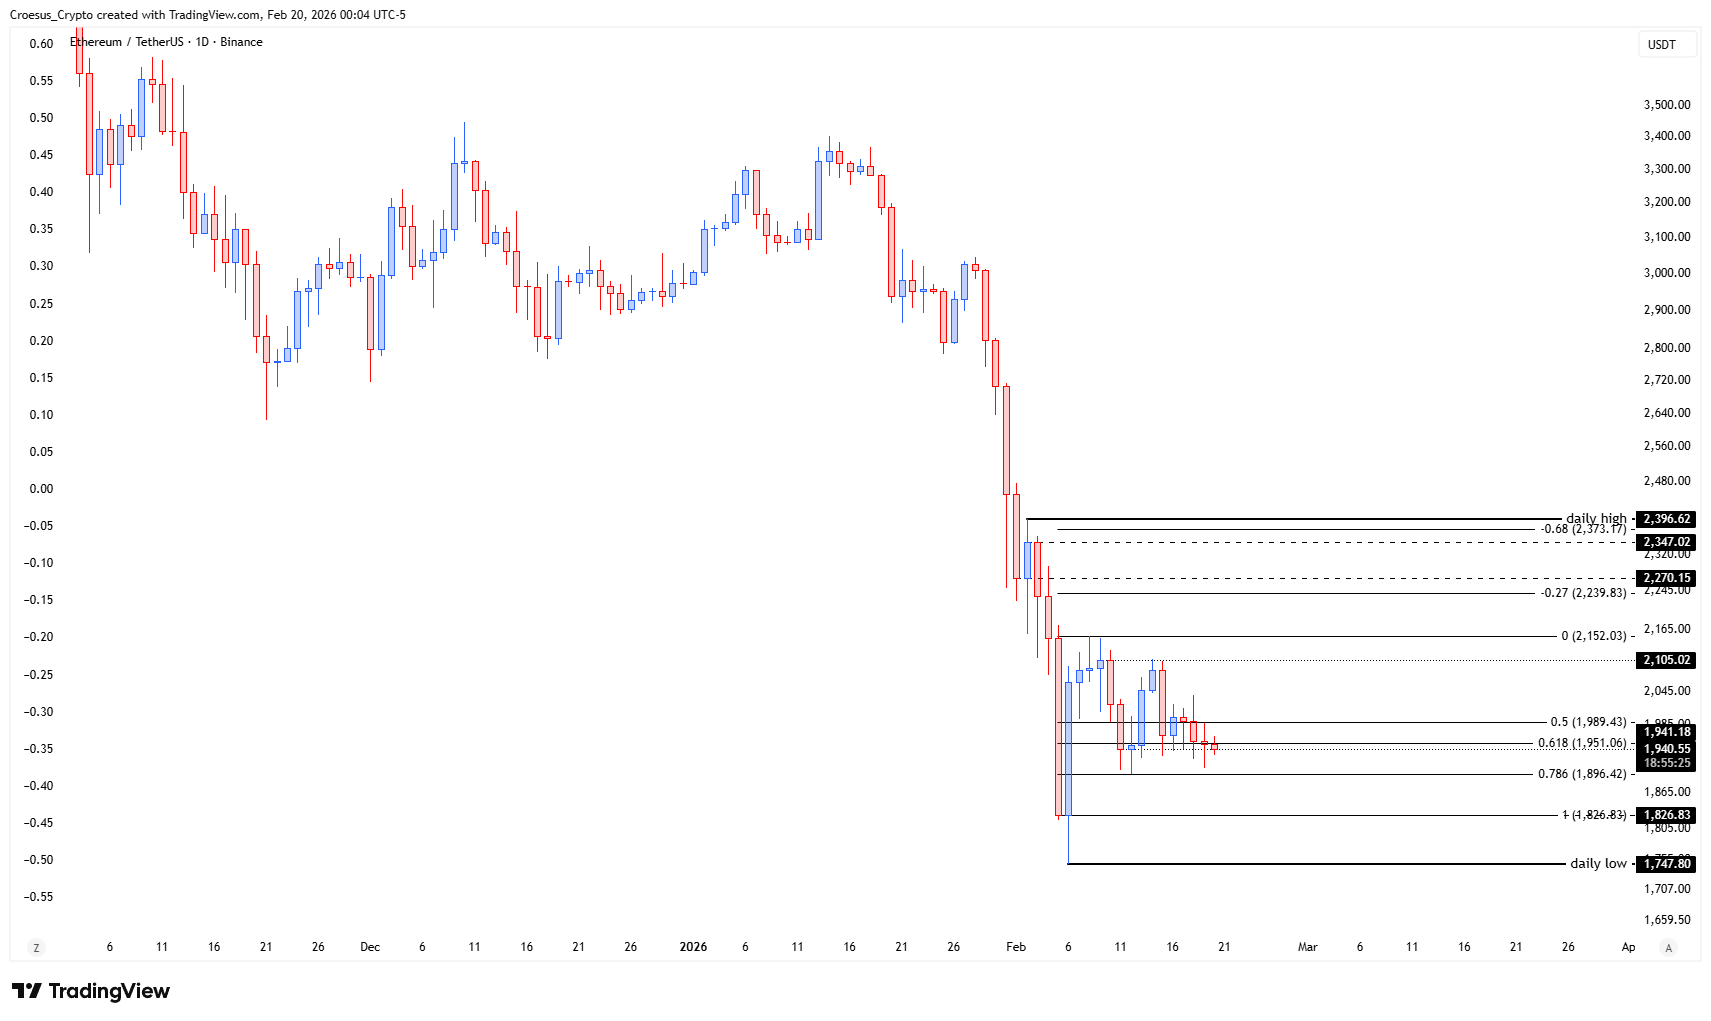
- Same as with TOTAL and BTC : the price is testing a key level : will this level act as support or do we see a retest of the daily low ?
- ABC-correction remains in play
Market Structure Analysis
Our technical analysis reads the recent structure as an impulsive selloff followed by an evolving ABC correction. The A-leg formed on the initial first push up, at this moment we are forming the B but still haven't seen any confirmation.
The current base roughly overlaps with the 0.5–0.618 Fibonacci retracement area of the last small upswing near 1,989–1,951, making it an important support resistance pivot. As long as ETH holds above this band, the corrective structure remains constructive; a clean break and daily close below would open room for a fast move back towards the 1,826 intermediate level and possibly the daily low.
Key Levels and Scenarios
Bullish scenario:
If buyers defend the current level and push price back above the short-term range highs, ETH daily analysis favors continuation of the ABC correction toward the 2,105 marker and potentially the higher resistance cluster around 2,270–2,396.
Critical levels to watch:
- $1,747 (daily low) – Primary downside invalidation; loss suggests the C-leg is starting.
- 1,775–1,826 – Short-term support and pivot; holding here keeps the B-leg thesis alive.
- 2,100 – Mid-range resistance and first objective for any bounce.
- 2,270–2,347 – Major resistance cluster, ideal zone to monitor for B-leg exhaustion
- 2,396 (daily high) – Key macro resistance; only a sustained break would weaken the broader bearish structure.
Trading Implications
Traders may treat the present level as a decision zone: aggressive entries near support require tight invalidation below the range, while conservative participants wait for a confirmed break above resistance before sizing up exposure.
This analysis is for informational purposes only and does not constitute financial advice.