


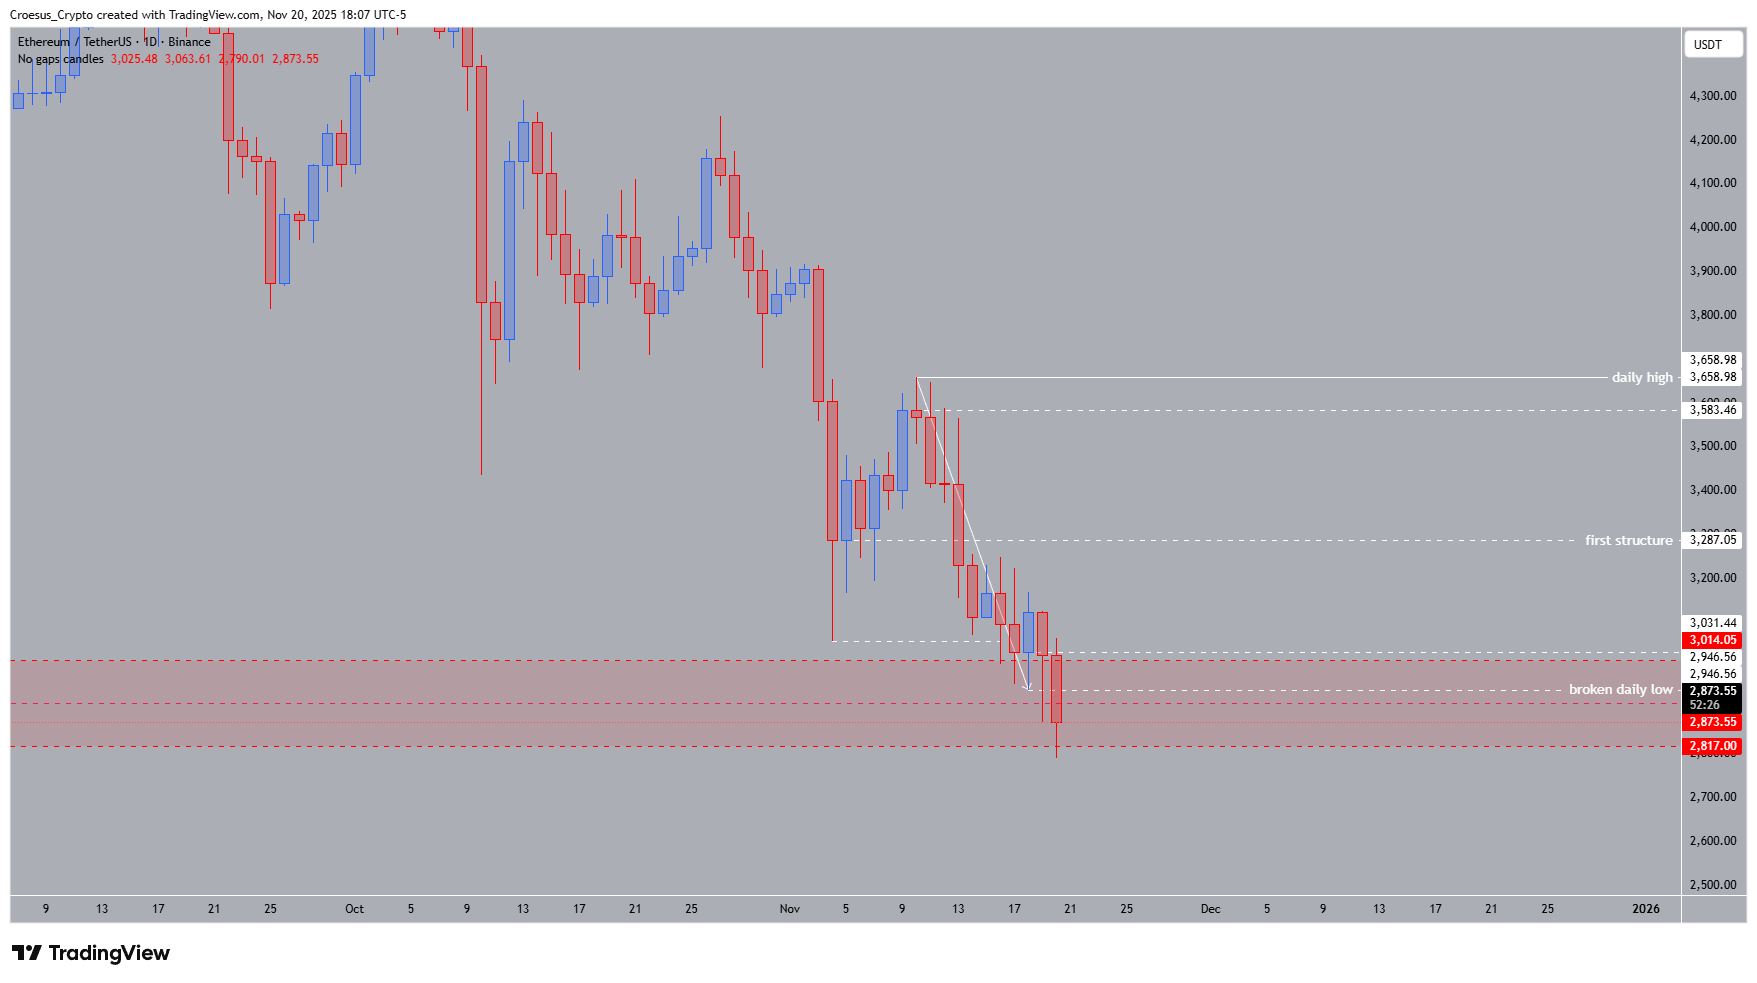
Ethereum ETHUSDT daily chart 20 November 2025 with first structure at 3,287, broken daily low at 2,946 and new swing low near 2,790.01$
- Trend = bearish ↓
- Technical Analysis Key Points
- Daily structure keeps printing lower highs and lower lows, with the previous daily low at 2,946 broken and a new low printed around 2,790$
- Price failed to hold above the monthly 3,014 area and remains below the broken daily low, confirming sellers in control beneath the first structure near 3,287.05.
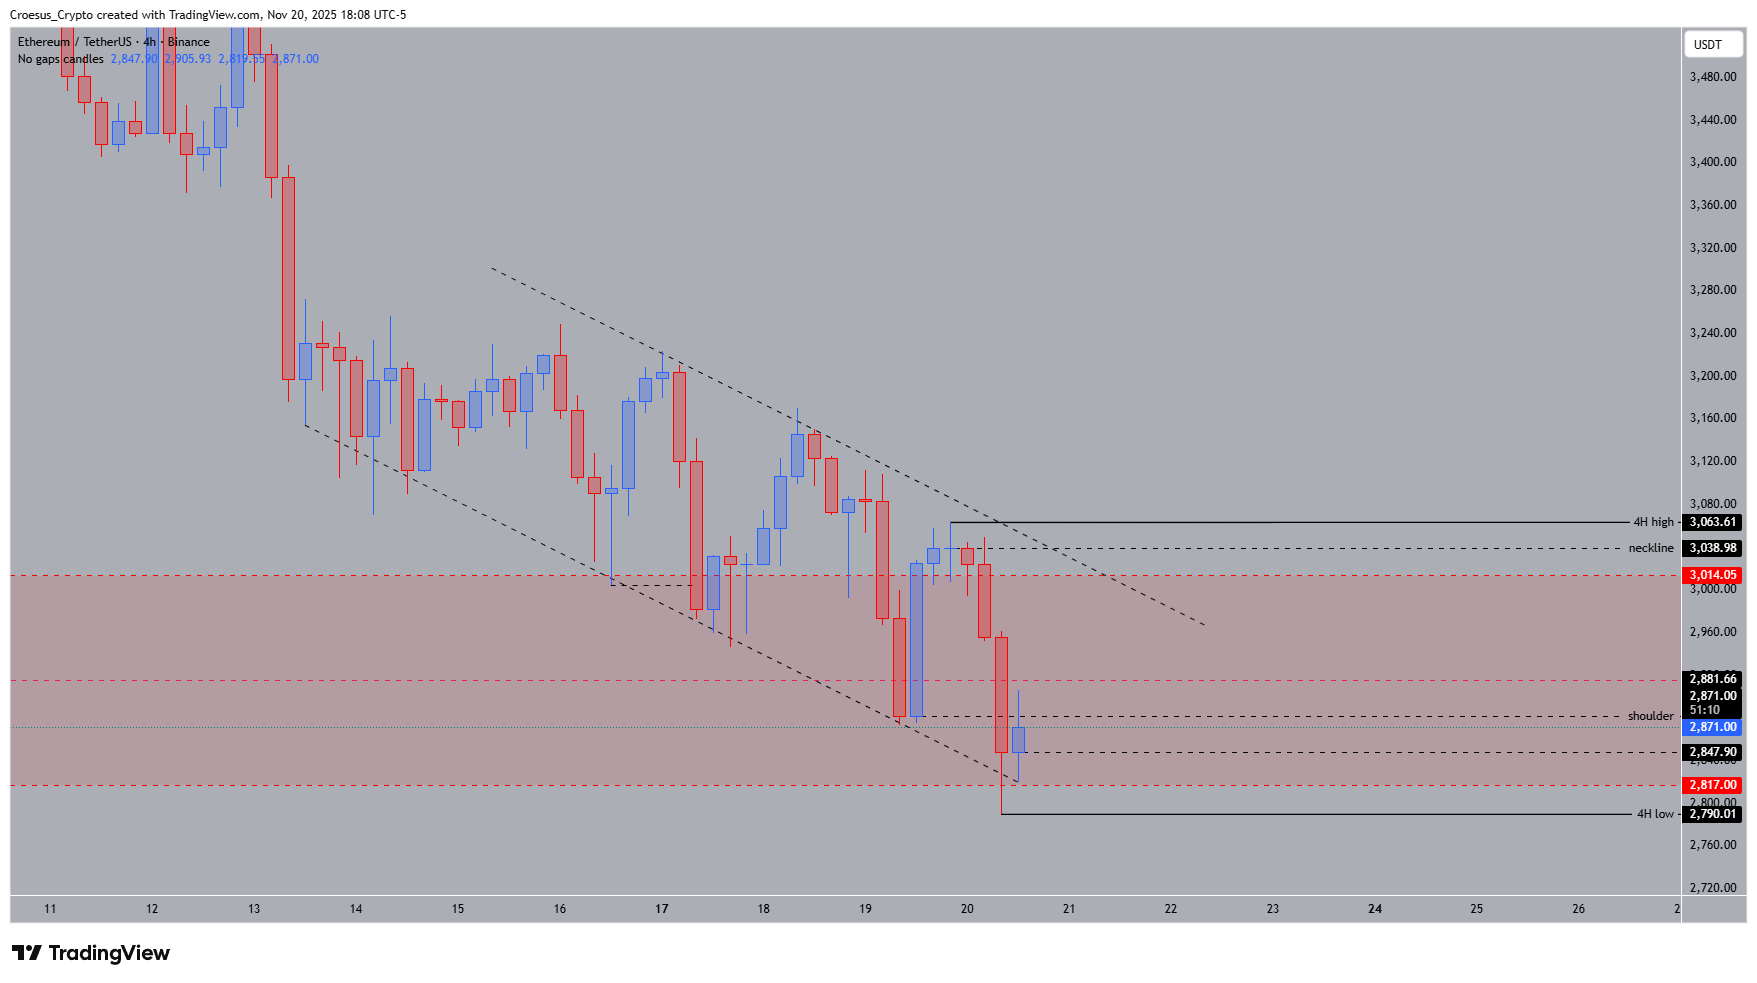
- On the 4H chart, ETH trades inside a clear descending channel and has set a fresh 4H low at 2,790.01$
- Within that channel, we see a potential inverse head and shoulders developing: shoulder at 2,881.66 $, head at 2,847.90 $, and a neckline around 3,038.98—still unconfirmed while price stays below it.
ETHUSDT 4H chart 20 November 2025 showing descending channel, 4H low at 2,790 and potential inverse head and shoulders with neckline at 3,039.
Market Structure Analysis
From a market structure perspective, this technical analysis shows Ethereum firmly in a downtrend on the daily timeframe, with every attempt to reclaim the broken daily low quickly rejected. The zone between 3,014 and 3,287 acts as a key support resistance flip, capping bounces since mid-November.
On 4H, the descending channel highlights persistent supply. The emerging inverse head and shoulders hints at potential exhaustion of the downside, but as long as price trades below the neckline and the 4H high at 3,063.61, it remains only a setup, not a confirmed reversal. We do not see a strong Fibonacci confluence to counter the current bearish flow yet.
Key Levels and Scenarios
Bullish scenario (counter-trend): A convincing 4H close back above 2,881.66 followed by a breakout over the 3,038.98-3,063.61 $ neckline/4H high zone would validate the inverse head and shoulders and open room toward 3,287.05 and potentially the daily high at 3,658.98.
Critical levels to watch
3,658.98 $ – Daily high: Key breakout requirement
3,287.05 $ – First structure: Major resistance, must flip
3,031.44–3,014.05 $ – Head zone: Liquidity pocket
2,946.56 $ – Daily low: Main downside target
2,817.00 $ – Lower liquidity: Possible sweep zone
Trading Implications
Given the dominant bearish trend, short setups on bounces into 2,873–3,014 remain favored, while conservative traders may wait for a confirmed break above the neckline and a higher low before considering new long exposure, always adjusting position size to volatility.
This content is for educational purposes only and does not constitute financial advice.