ETH Marketcap / Ethereum
ETH daily analysis 20/04/2026. Ethereum is trading at a key inflection area after a failed break above the daily high, with price rotating back into the prior daily range and forcing a more cautious read on near-term direction.
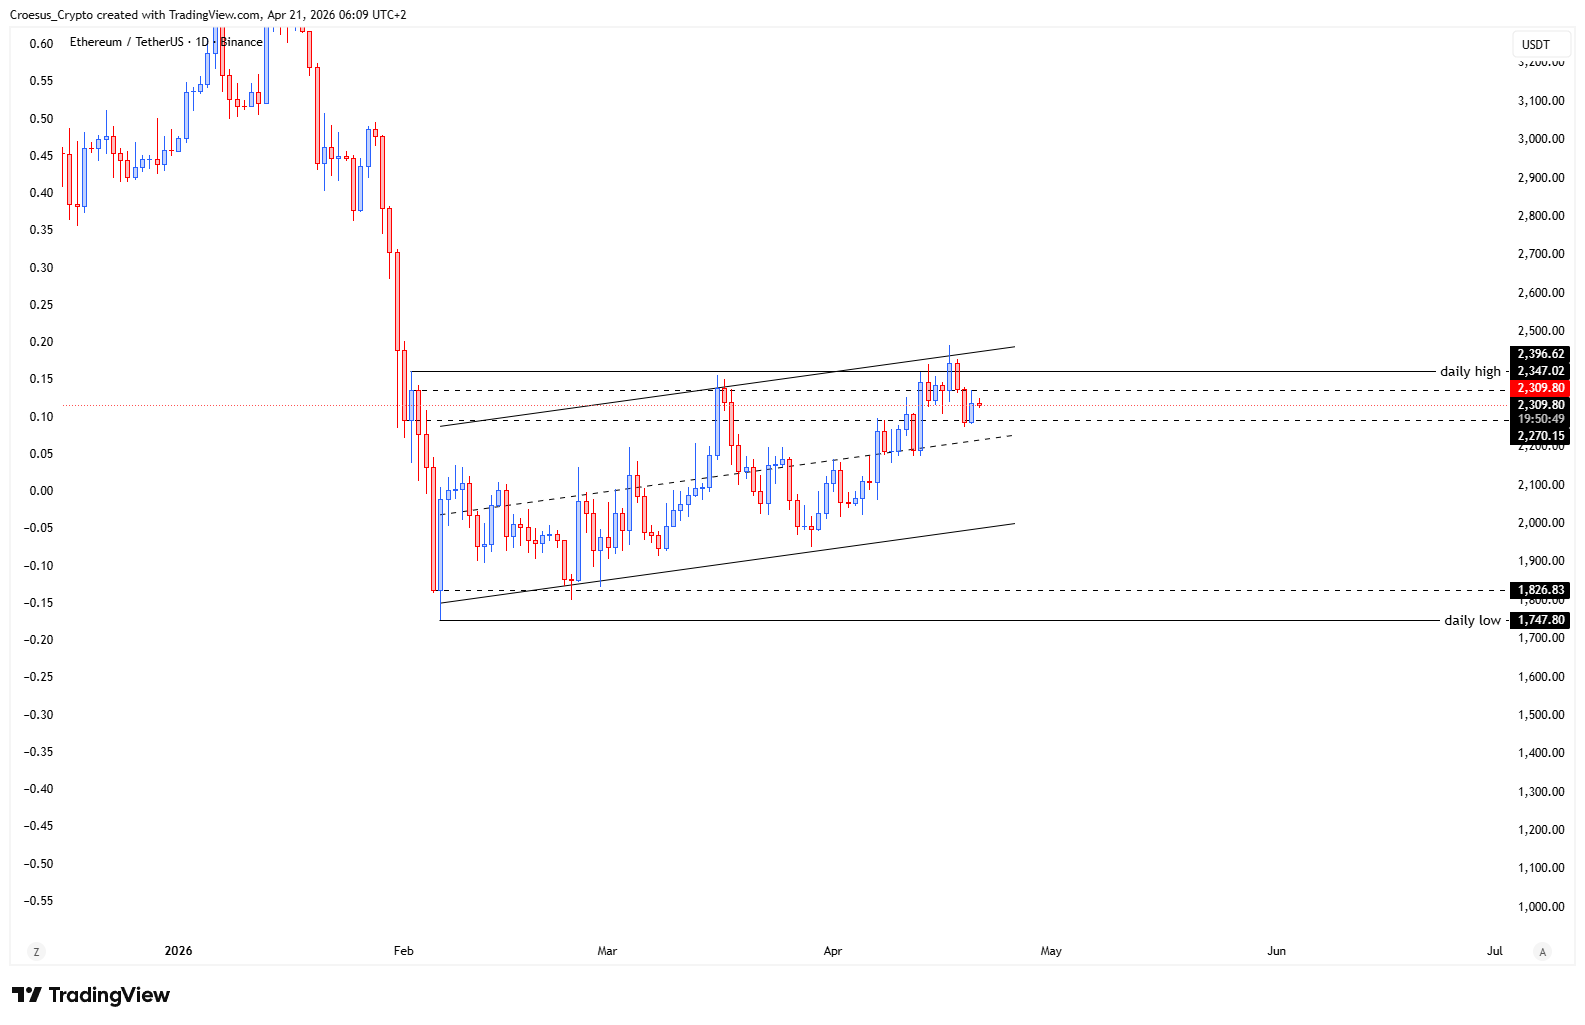
- The ETH price shows us that the price pushed past the daily high but got rejected and faked out back into the daily range.
- Eventhough the last weeks we kept building our bullish conviction up, we need to remain neutral in our analysis at this moment. This is a key moment. We had a fib 100 % retracement, even a fake out.
- Bullish : break and hold of the daily high
- Bearish : creating a reversal pattern (head and shoulders) at the daily high and creating lower low/lower high structure, to loose the lower limit of the rising channel.
Market Structure Analysis
From a naked-trading perspective, this ETH daily analysis is defined by a liquidity-style push above the daily high followed by an immediate rejection back into the range.
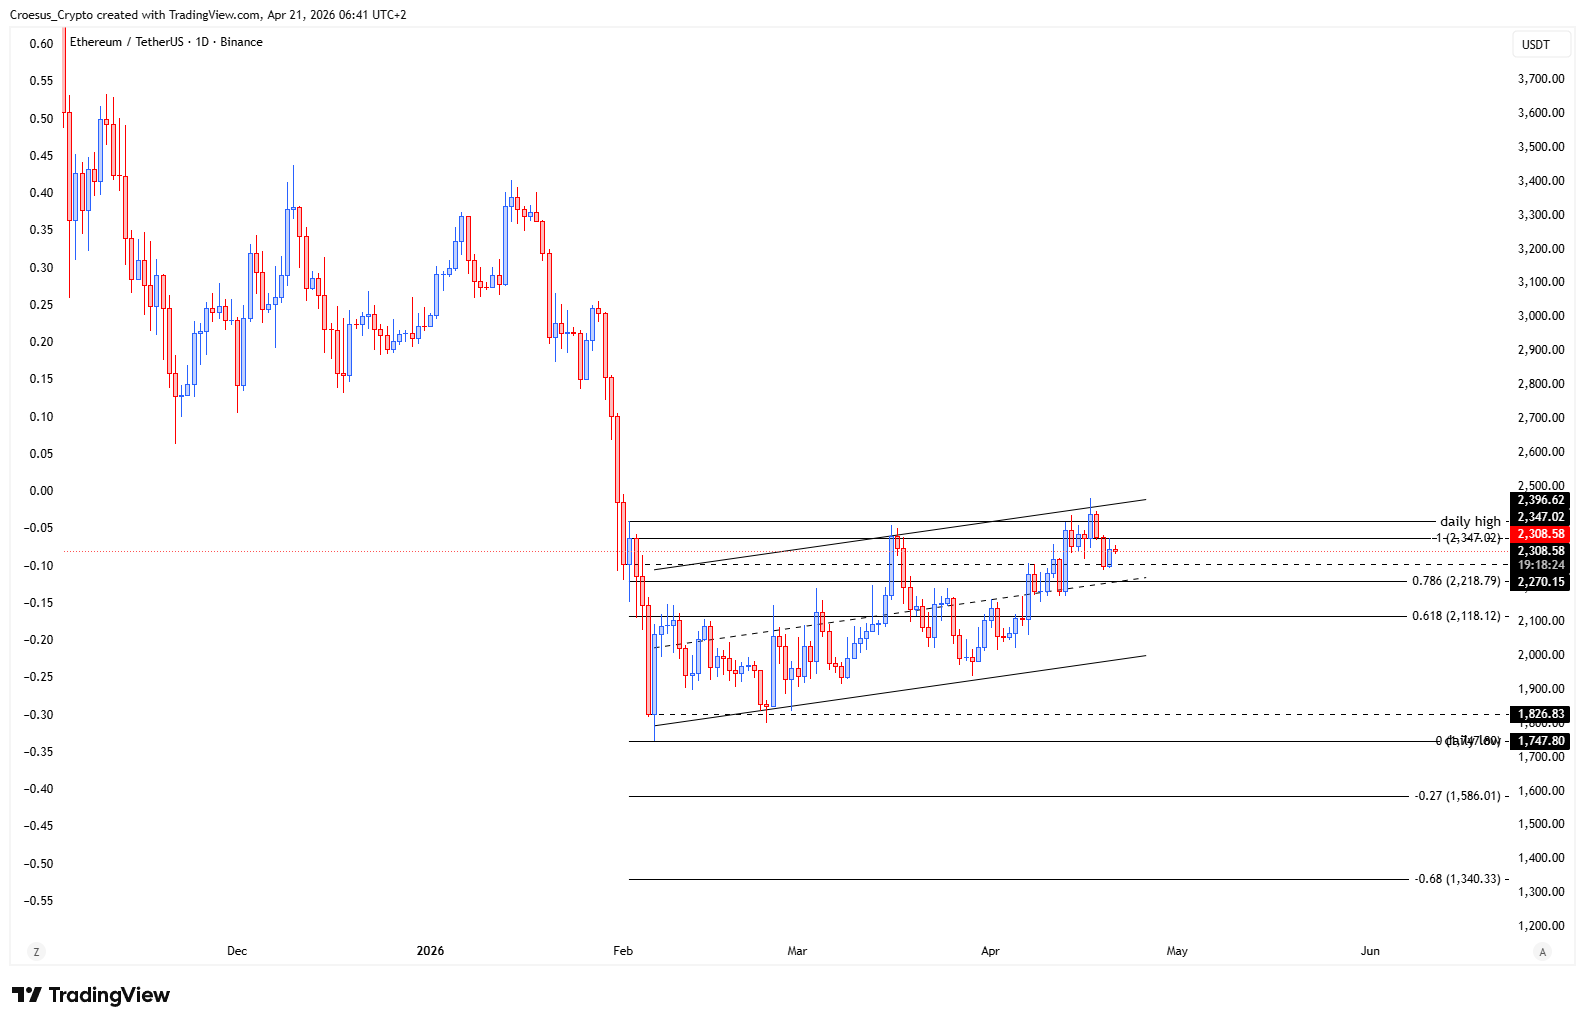
Structurally, that behavior often signals a failed breakout and can mark the start of distribution if price begins printing lower highs and lower lows. The mention of a fib 100 % retracement reinforces that the prior move has been fully retraced, increasing the odds that the market is still corrective rather than in a clean impulsive continuation. The rising channel remains the key framework: as long as price holds the channel structure and respects horizontal support/resistance inside the range, the market can stay rotational; losing the channel low would shift structure decisively bearish.
Key Levels and Scenarios
Bullishly, ETH needs acceptance back above the daily high to invalidate the fakeout and re-establish upward market structure. Bearishly, rejection at the daily high combined with a developing head and shoulders and a break of the rising channel would confirm a transition into a lower low/lower high sequence.
- Daily high: must break and hold to reclaim bullish continuation
- Daily range boundaries: current support resistance framework while price is back inside the range
- Rising channel lower limit: key structural support; a loss signals bearish continuation risk
- Area around the fib 100 % retracement: reaction zone that often decides whether the move was corrective or a reversal
This analysis is for informational purposes only and does not constitute financial advice.