


ETH Marketcap / Ethereum
ETH daily analysis 20/05/2026. Ethereum is attempting a local stabilization on the daily timeframe, but our technical analysis still treats the broader context as bearish while price remains capped inside consolidation.
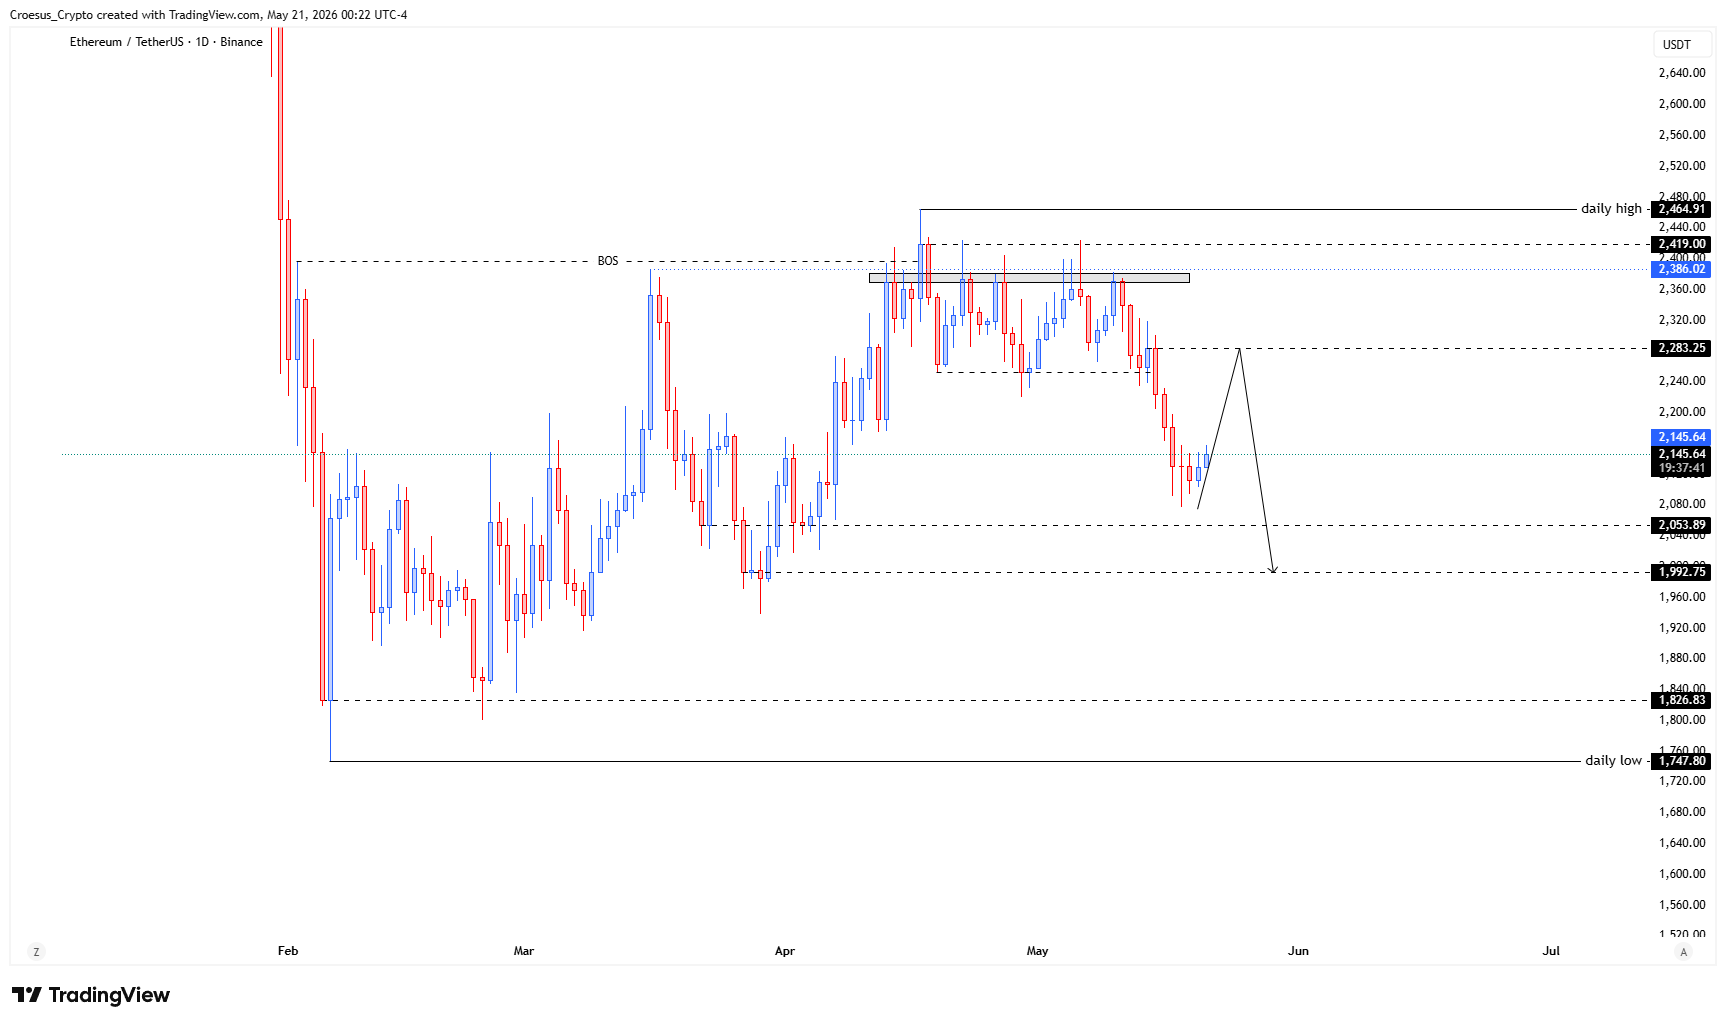
- ETH daily analysis shows us the price printed a first bullish candle, possibly initiating a local bullish relief
Market Structure Analysis
From a naked trading perspective, ETH remains in a corrective structure on the daily timeframe, with price consolidating after a prior directional move. Structurally, this reads as compression between a range high and range low, where buyers defend the floor and sellers continue to cap upside, keeping the support resistance framework clean and tradable. In a bearish environment, this type of consolidation often acts as a pause before continuation, but it can also become a reversal base if price reclaims key structure and proves acceptance on a retest. With FOMC meeting minutes yesterday and PMI today, our ETH daily analysis treats the current range as a decision zone where liquidity is likely building on both sides, increasing the probability of a stop-run or sharp expansion once catalysts hit.
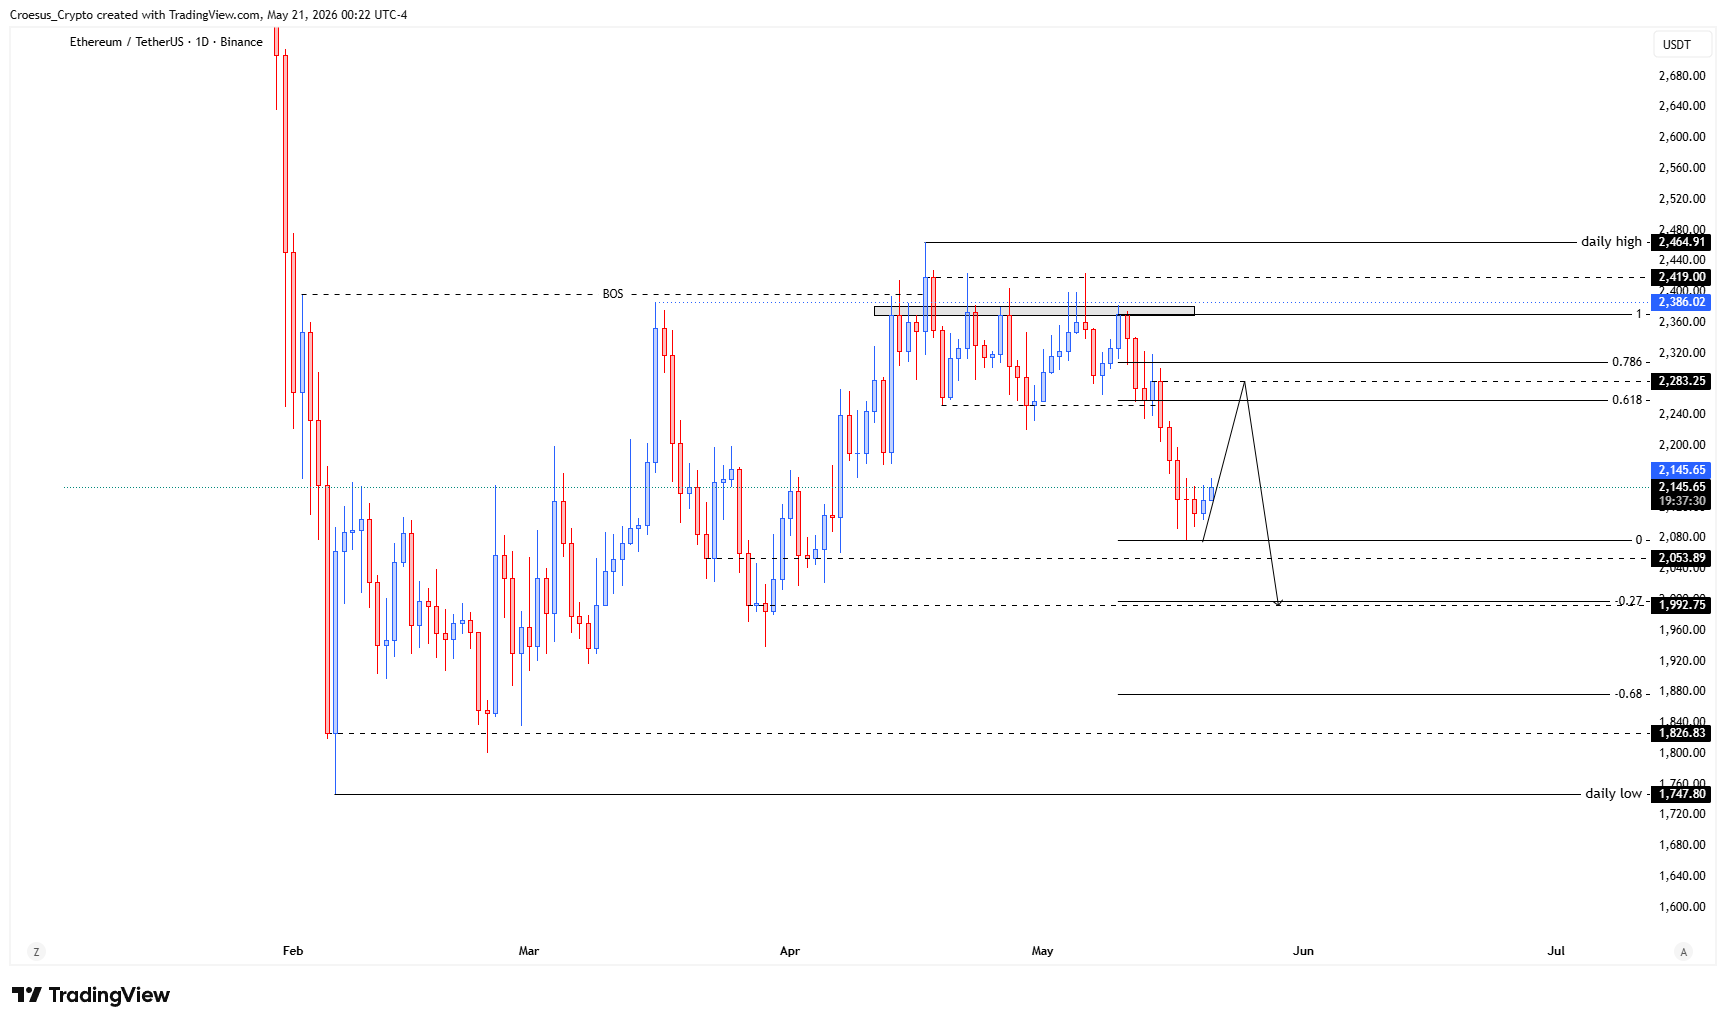
Key Levels and Scenarios
For this ETH daily analysis, the main framework is to respect the consolidation boundaries and wait for structure to confirm direction. Bearish continuation is favored if price breaks and accepts below the consolidation low, then fails a reclaim (former support turning into resistance). The alternative is a bullish reclaim if ETH breaks above the consolidation high and holds that level on a retest, shifting short-term structure.
- Consolidation range high (key resistance cap that must break for a reclaim)
- Consolidation range low (key support floor that must hold to avoid continuation)
- Range midpoint (common reaction zone and compression pivot)
- Most recent swing high (liquidity area above resistance)
- Most recent swing low (liquidity area below support)
Trading Implications
In a news-driven environment, our technical analysis prioritizes acceptance and retest behavior over wicks and headline spikes. Aggressive participants typically focus on breakout acceptance at the range boundaries, while conservative participants often wait for a cleaner break of structure to reduce chop risk. Until ETH exits the range with confirmation, wick-driven stop hunts remain the primary risk.
This analysis is for informational purposes only and does not constitute financial advice.