


ETH Marketcap / Ethereum
ETH Daily Analysis 26 January 2026. Our ETH daily analysis shows price interacting with the lower boundary of the daily range, while broader context remains bearish across both daily and weekly structure.
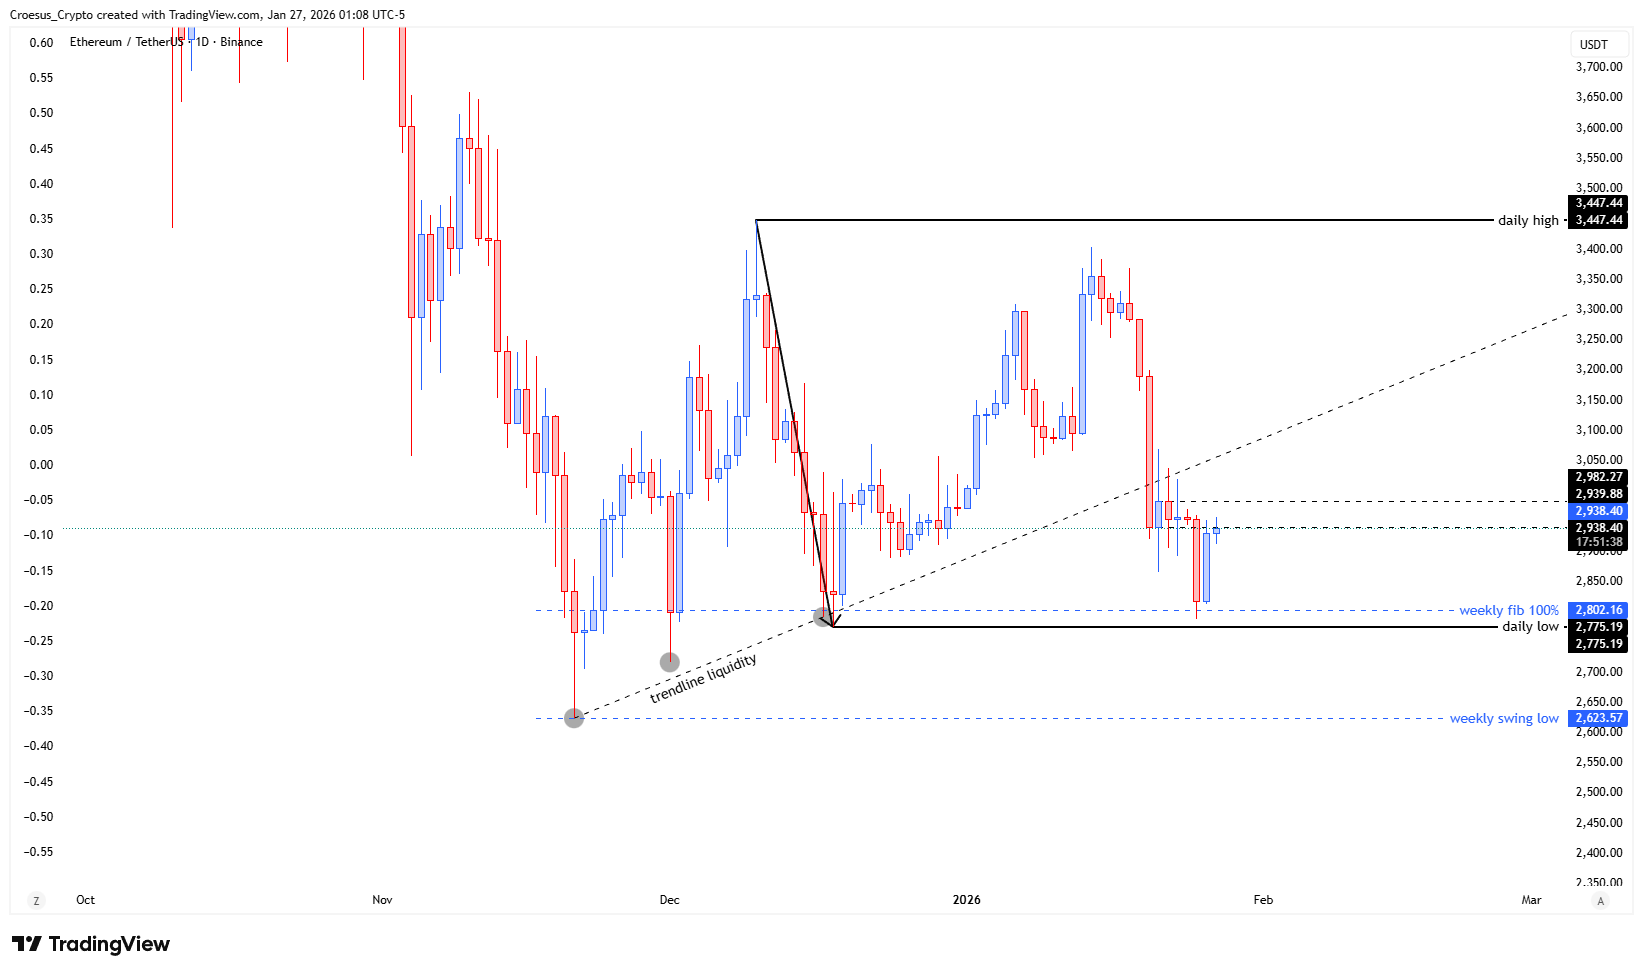
- On Sunday price pushed down to the downside of the daily range
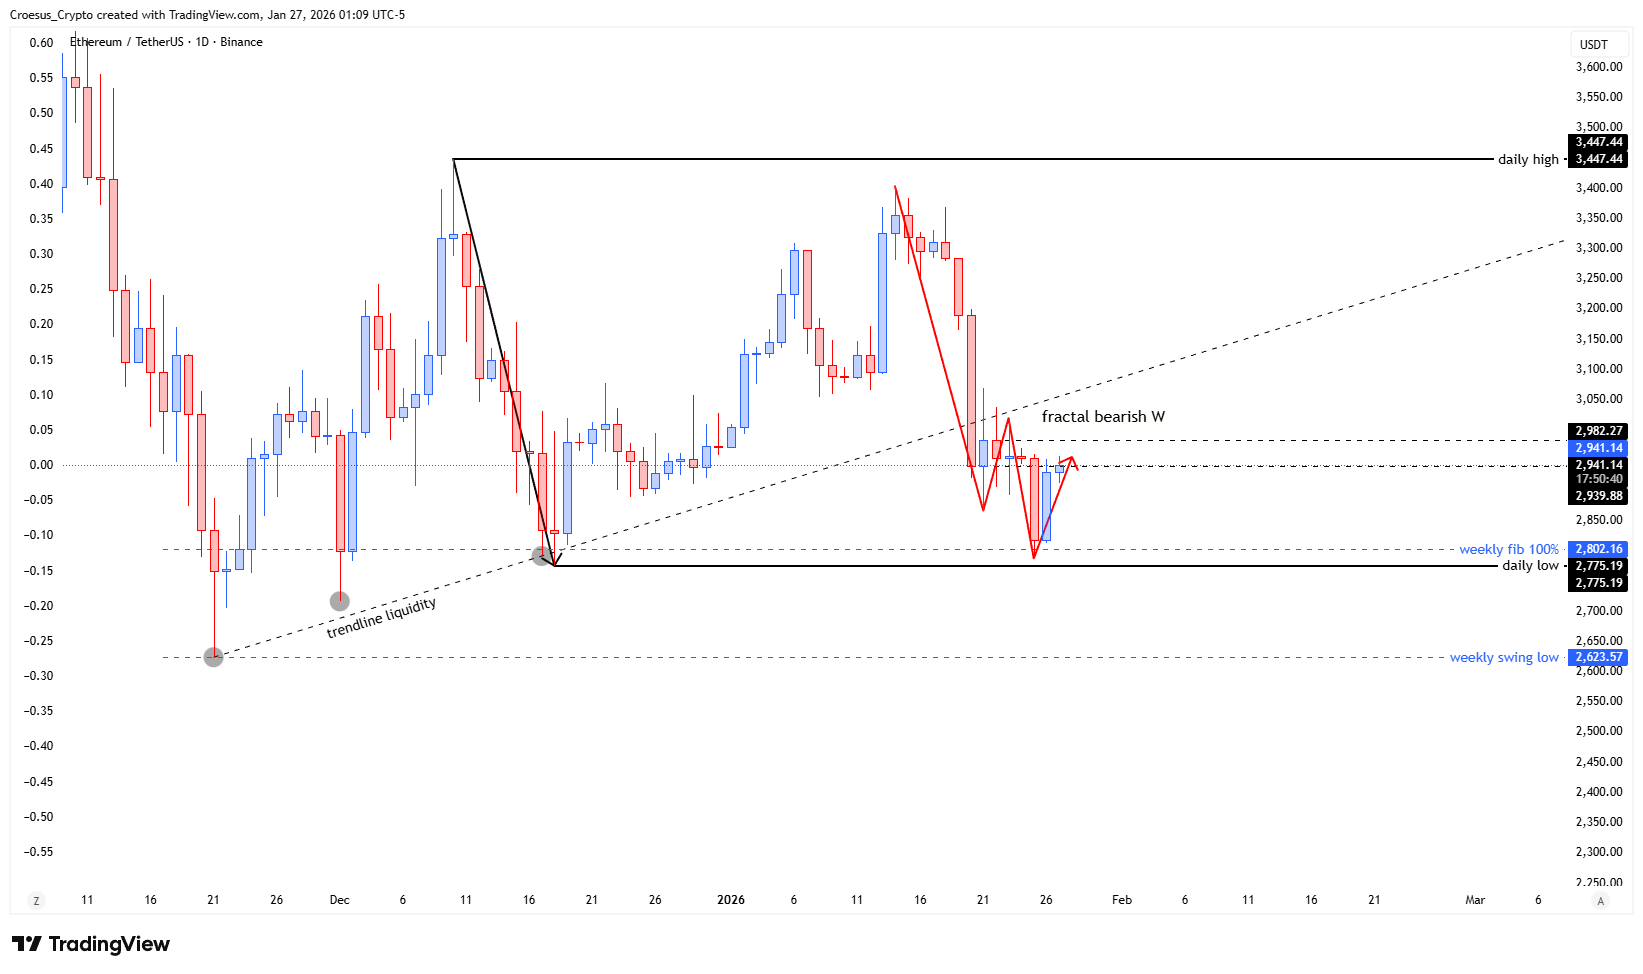
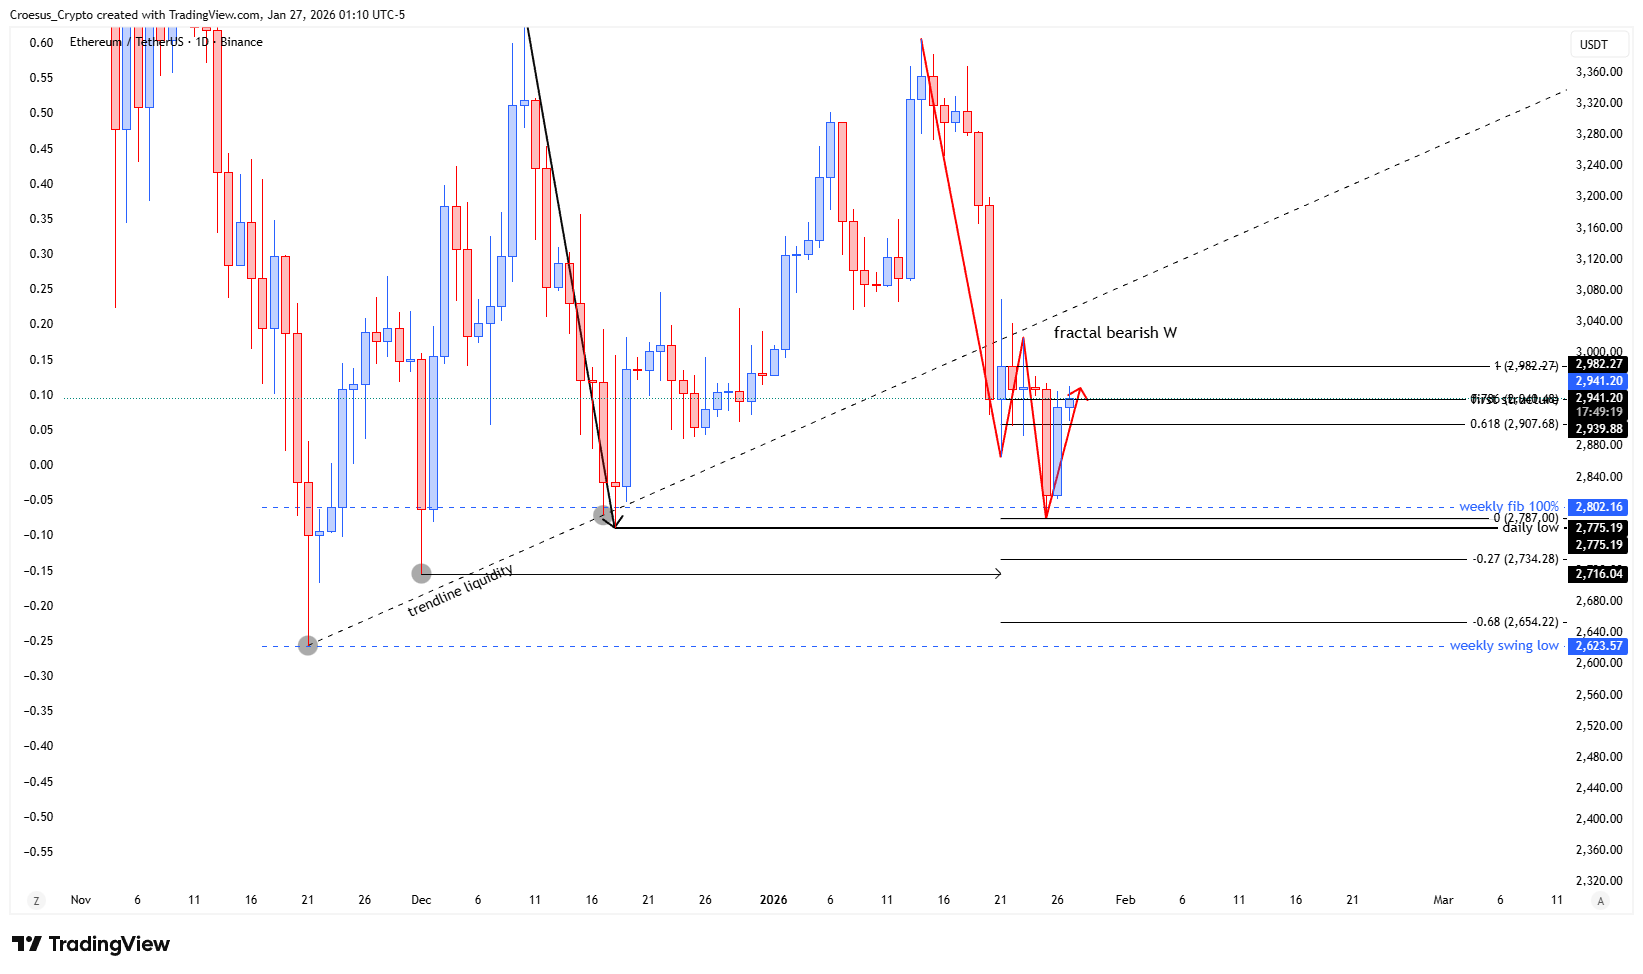
- This push down was partially reclaimed on Monday, giving us a potential bearish W set-up. As we are still bearish on the daily and the weekly chart, this is the set-up we prefer. At this moment we touched the first structure within the golden pocket (between the 0.618 and 0.786 retracement levels).
- If we see the bearish W play out until the -0.68 target level, we can see the weekly fib 100% being swept and the lows within the weekly fake out zone.
Market Structure Analysis
This ETH daily analysis is centered on a clean range interaction: price pushed into the downside of the daily range, then partially reclaimed it. Structurally, that reclaim is important because it often acts as the decision point between continuation (bearish acceptance below the range) versus a deeper corrective bounce back into prior structure.
The draft highlights a “potential bearish W set-up” forming as price reacts to the first structure inside the golden pocket (0.618–0.786). With daily and weekly bias still bearish, our technical analysis treats this reclaim as corrective unless price proves otherwise through sustained acceptance above reclaimed structure. If downside continuation resumes, the confluence with the weekly context matters: a move toward the stated -0.68 target would align with a potential sweep of the weekly fib 100% and probe into the weekly fake out zone, which is often where liquidity sits below prior swing lows.
Key Levels and Scenarios
In this ETH daily analysis, the bearish scenario remains favored while price stays heavy around the lower range and fails to convert reclaimed structure into support resistance. Continuation is defined by acceptance back below the daily range downside and follow-through toward the stated extension target and weekly liquidity. A bullish alternative requires sustained strength through the reclaim area and a clean shift back into higher range territory (without immediate rejection).
- Downside of the daily range (key support/resistance decision zone)
- First structure within the golden pocket (0.618–0.786 retracement levels)
- -0.68 target level (extension target for the bearish W set-up)
- Weekly fib 100% (potential sweep/liquidity trigger)
- Lows within the weekly fake out zone (weekly liquidity area)
Trading Implications
From a risk perspective, the current zone is a compression area where invalidations can be tight but whipsaws are common. Conservative participation typically waits for acceptance (daily close/hold) either back below the range low for continuation or back above reclaimed structure for a clearer corrective shift, keeping the weekly sweep scenario in focus.
This analysis is for informational purposes only and does not constitute financial advice.