


ETH Marketcap / Ethereum
ETH daily analysis 27 January 2026. Ethereum is currently trading inside a broader daily range, with price reacting around a key Fibonacci reference and a “fake out zone” that can trap early positioning on both sides.
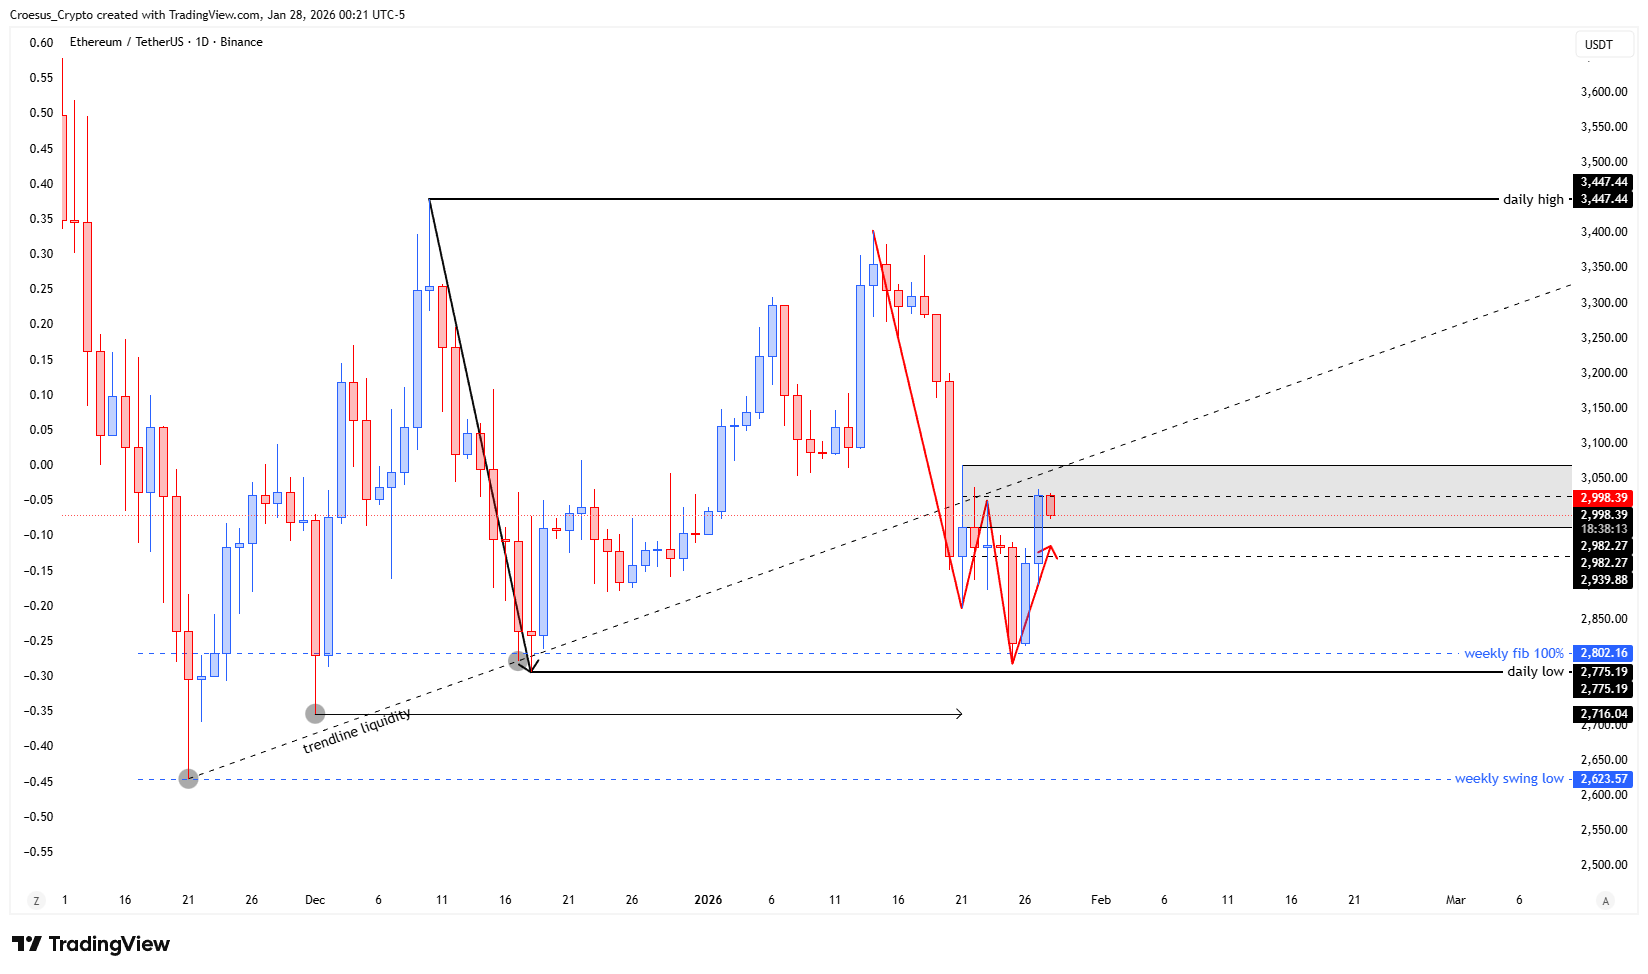
- The price of ETH had a somewhat more impulsive corrective past the 100% fib retracement into the fake out zone.
- As ETH is moving within a broader daily range than TOTAL and BTC, we have to take the fractal daily high and low into account. Neither have been broken.
- At this moment the bearish W is still active, but the move into the fake out could entice early buyers to open long positions. This is, at this moment, not our set-up.
Market Structure Analysis
From a naked trading perspective, our ETH daily analysis remains range-first: price is rotating inside a broader daily structure, and the “fractal daily high and low” define the active boundaries. Because neither boundary has broken, any move inside the range is still treated as corrective until proven otherwise by a clean break of structure and acceptance beyond the range high/low. The push “past the 100% fib retracement into the fake out zone” reads as a more impulsive corrective leg that can create a false sense of continuation, especially if liquidity is being engineered around prior swing references. With the “bearish W” still active, the current rally/relief move is structurally suspect, even if it visually looks like it could attract early dip buyers.
Key Levels and Scenarios
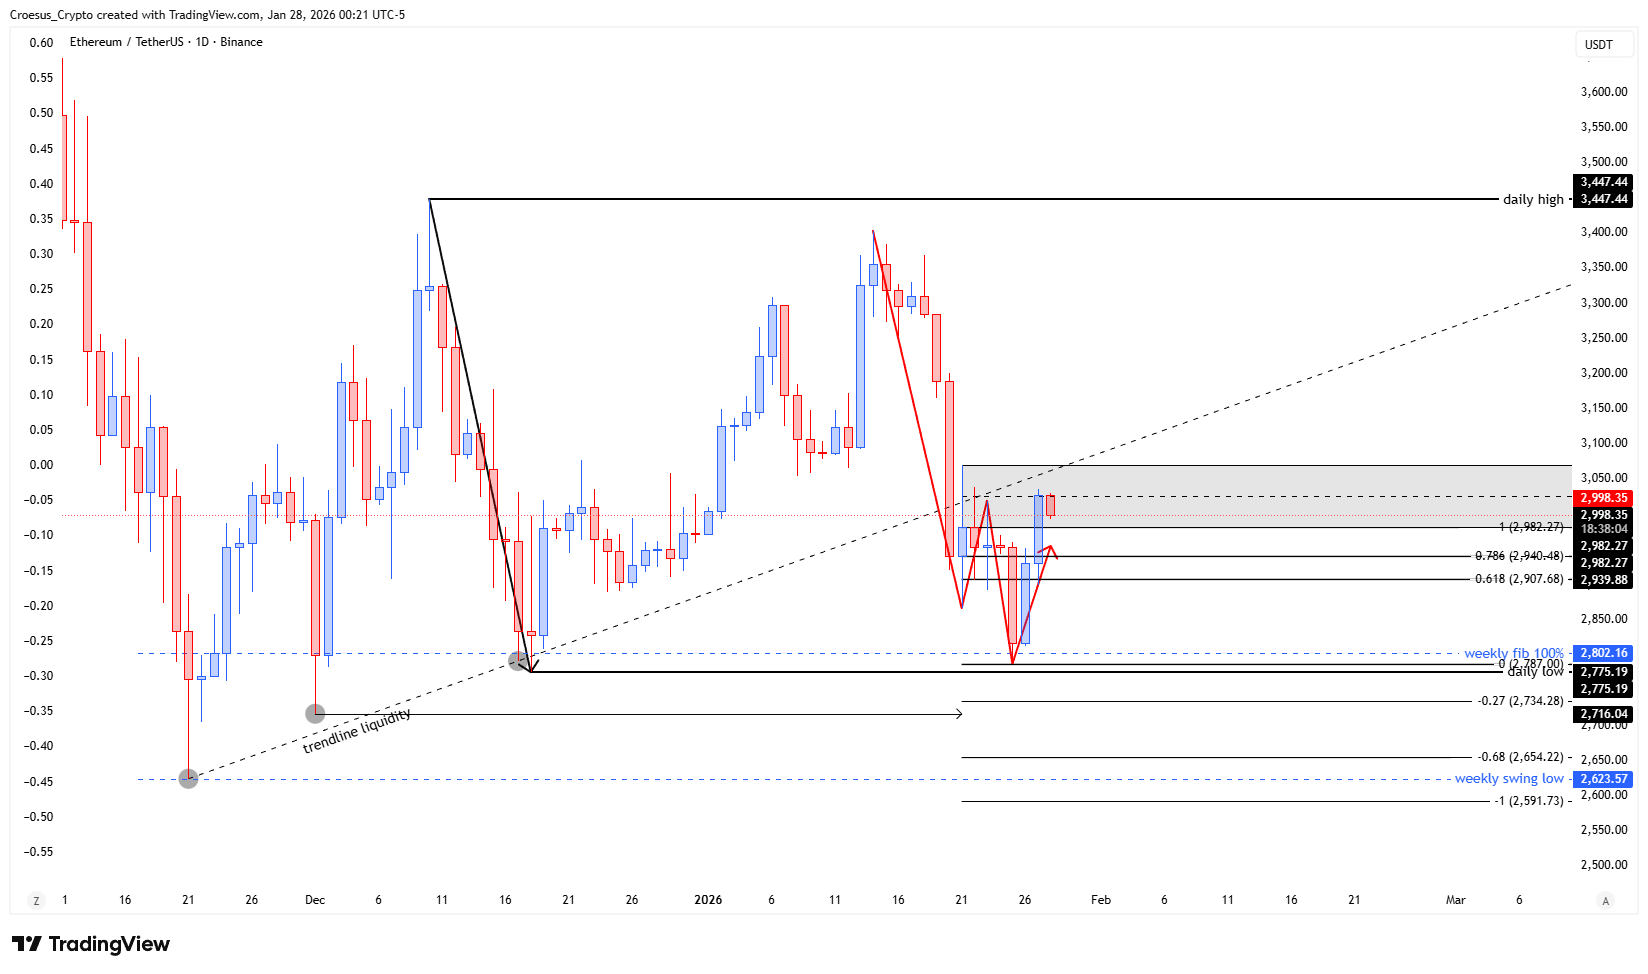
For ETH daily analysis, the main conditions are defined by support resistance at the range extremes and the market’s response to the 100% Fibonacci area. A bearish continuation scenario keeps the “bearish W” active and favors rejection from the fake out zone back into the range. A bullish scenario requires reclaiming and holding above the fake out zone, followed by a break and acceptance beyond the fractal daily high to confirm a real structural shift rather than a trap.
- Fractal daily high: key range resistance; break/acceptance is required to shift structure bullish
- Fractal daily low: key range support; loss of this level keeps downside pressure in control
- 100% fib retracement area: pivotal reaction zone within the current corrective leg
- Fake out zone: high-risk area for traps; needs acceptance to validate continuation
Trading Implications
Until the range breaks, risk remains asymmetric around the boundaries: aggressive traders may trade rotations, while conservative traders typically wait for confirmation via break of structure and clean retests. As stated in our ETH daily analysis, the current move can entice early longs, but without a confirmed structural break, the setup remains vulnerable to a liquidity-driven reversal.
This analysis is for informational purposes only and does not constitute financial advice.