


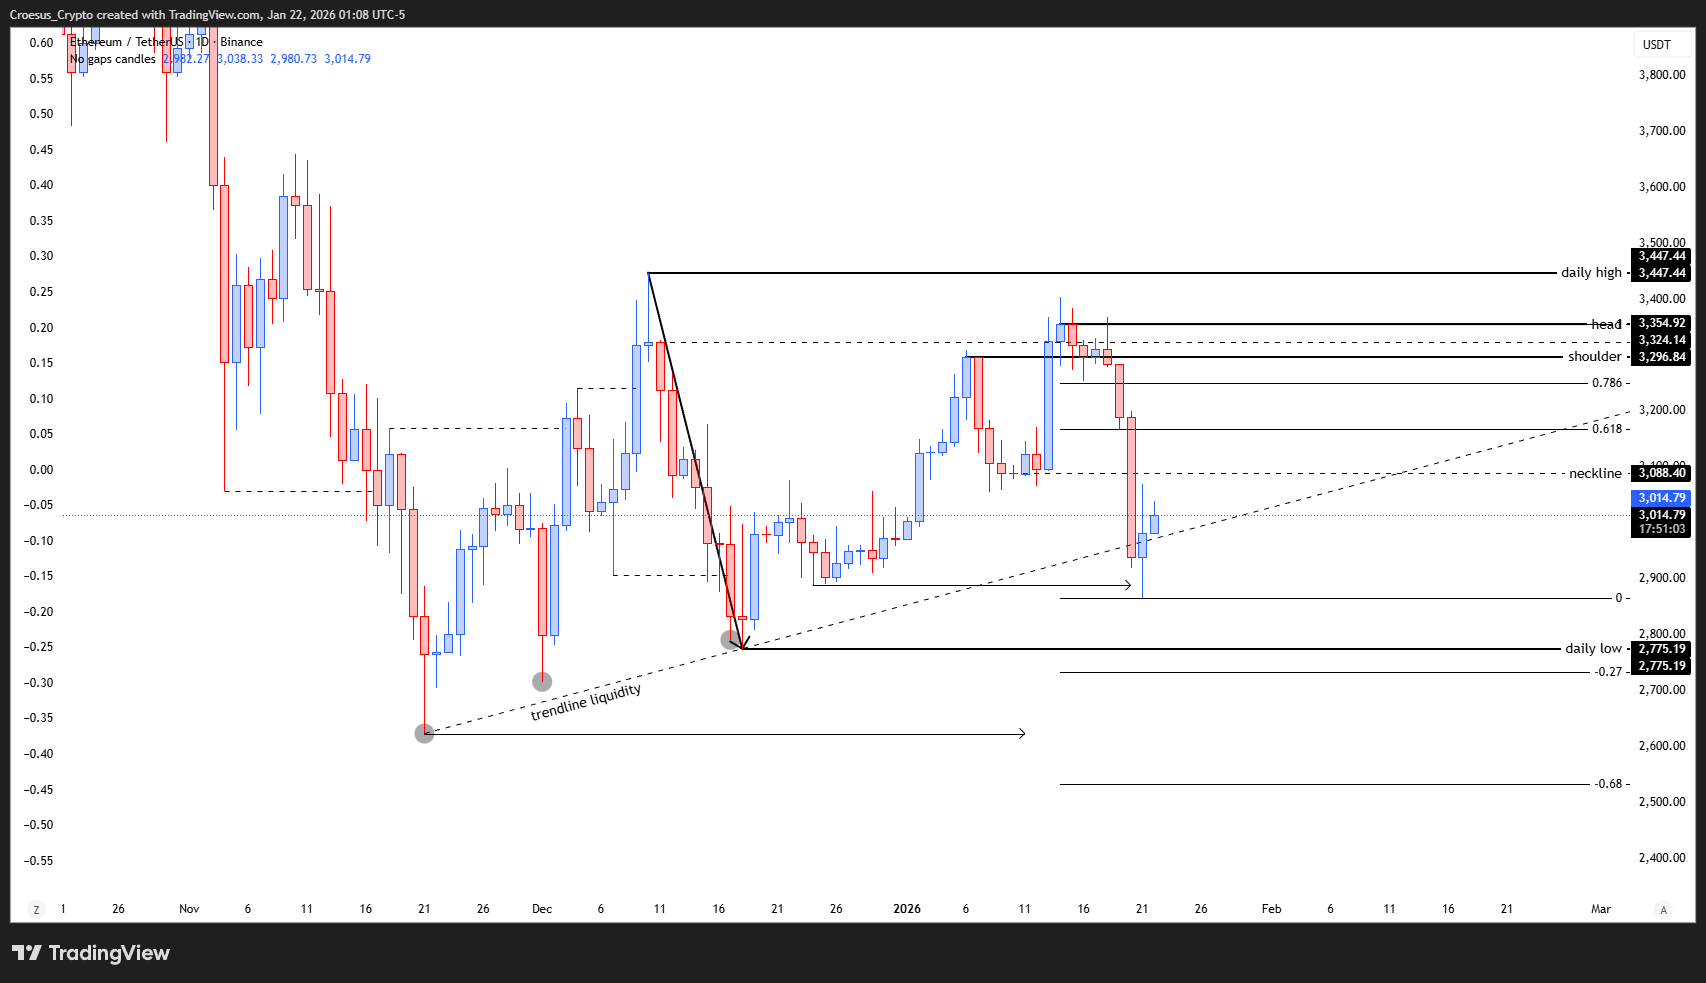
In our ETH daily analysis for 21 January 2026, Ethereum extended its corrective leg slightly below the rising trendline before buyers stepped in and printed a bullish daily candle around the 3,000 USDT area. This reaction gives us a clear swing high at the recent “daily high” near 3,447 USDT and a swing low at the current wick, so we can now apply a precise Fibonacci retracement to frame the ongoing correction and update our support resistance map.
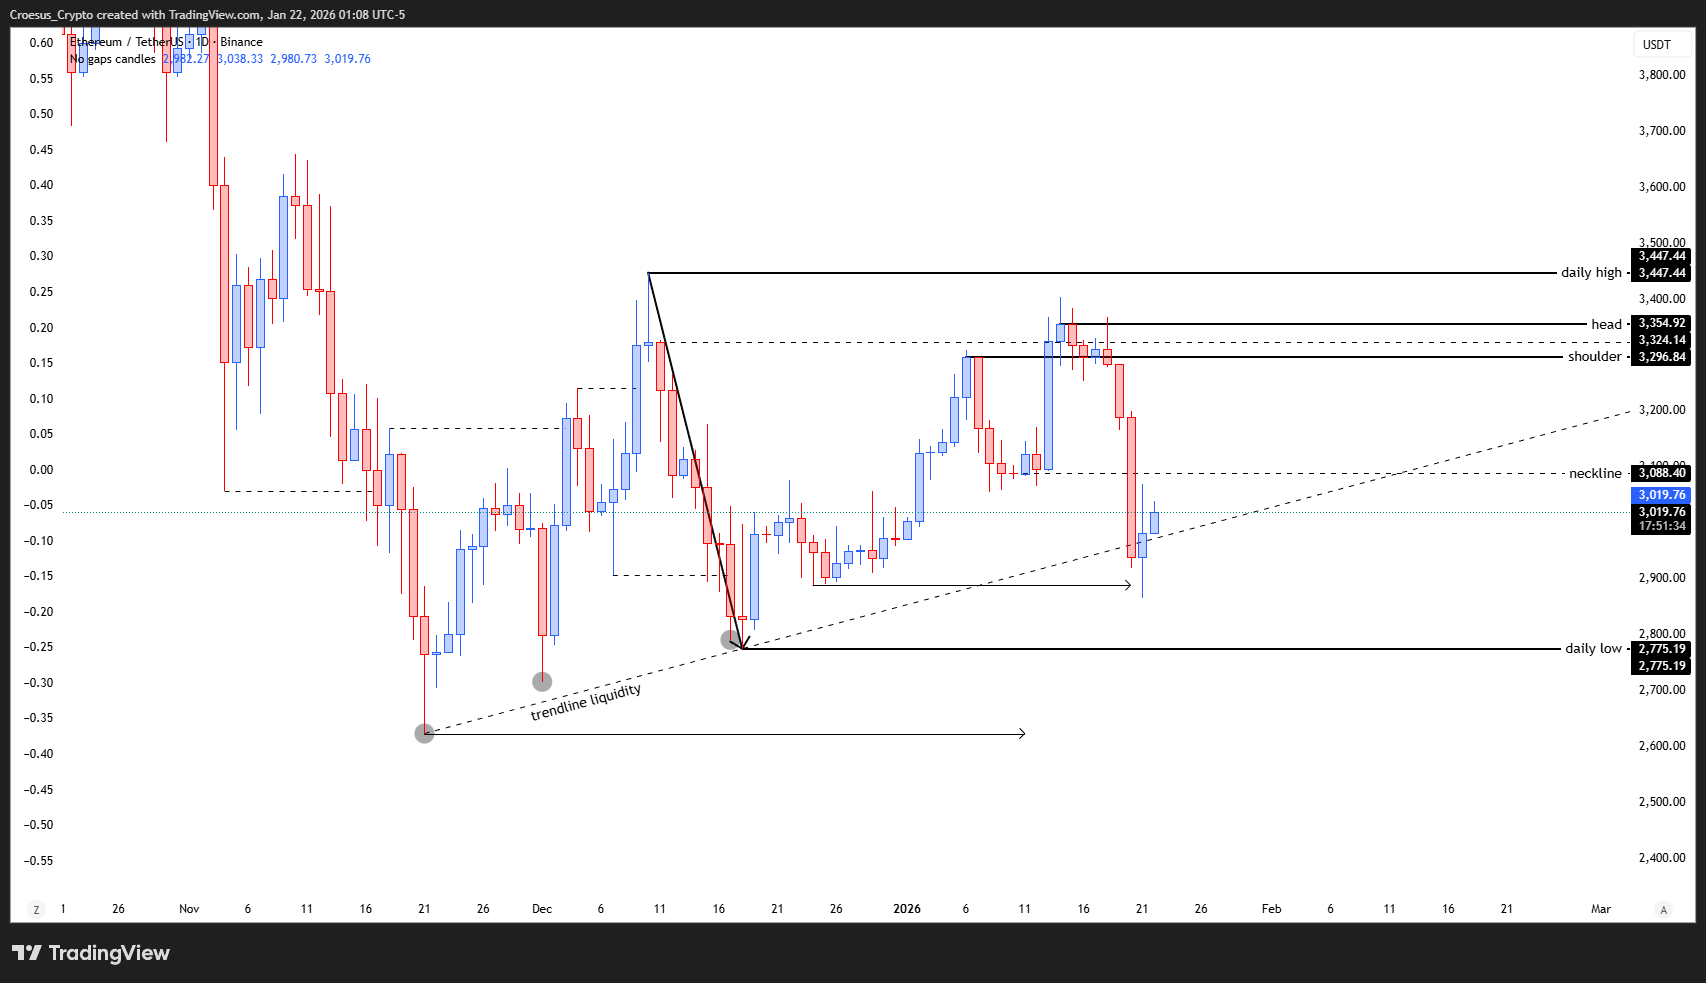
ETH daily chart 21 January 2026 with trendline liquidity, neckline, shoulder, head and daily high/low levels
Technical Analysis Key Points
- The index pushed a little further down but finished with a bullish candle.
- This mean that we can draw our fib retracement now.
- The correction is continuing as analysed.
Market Structure Analysis
From a technical analysis perspective, ETH is still respecting the broader ascending structure that started from the “trendline liquidity” lows around 2,400–2,500 USDT. The latest impulsive drop from the daily high at 3,447 USDT broke back below the head region (3,354 USDT) and the shoulder zone around 3,296–3,324 USDT, with price currently trading just under the neckline at 3,088 USDT. The bullish reaction from the rising trendline suggests responsive buying, but as long as price remains below the neckline and the 0.618–0.786 Fibonacci band, this move is best viewed as a correction rather than a confirmed bullish reversal. The Fibonacci 0.618 level aligns closely with the neckline, while the 0.786 sits between the shoulder and head, forming a strong confluence resistance area.
Key Levels and Scenarios
Bullish scenario: If ETH defends the current lows above the daily low at 2,775 USDT and reclaims the neckline near 3,088 USDT, our ETH daily analysis anticipates a push into the 0.618–0.786 Fibonacci zone between roughly 3,100–3,300 USDT, where sellers are likely to react again.
Levels to watch
3,447 USDT – Daily high: Origin of the current downswing and major resistance.
3,354 USDT – Head level: Intermediate resistance inside the corrective range.
3,296–3,324 USDT – Shoulder area: Strong prior support turned resistance.
3,088 USDT – Neckline: Key intra-day pivot for support resistance flips.
2,775 USDT – Daily low: Primary downside support; loss of this would open room toward earlier liquidity around 2,500 USDT.
Trading Implications
Traders may look for short-term opportunities either on rejection from the neckline/Fibonacci confluence for continuation of the correction, or on a confirmed break-and-hold above the shoulder region for a more sustained recovery, always sizing positions conservatively relative to account risk.
This content is for educational purposes only and is not financial advice or a recommendation to buy or sell any asset.