ETH Marketcap / Ethereum
ETH Daily Analysis 21/04/2026. Ethereum remains technically bearish on the daily timeframe, with price currently pressing back into the daily highs where a potential reversal attempt needs confirmation before our analysis can consider a meaningful shift in structure.

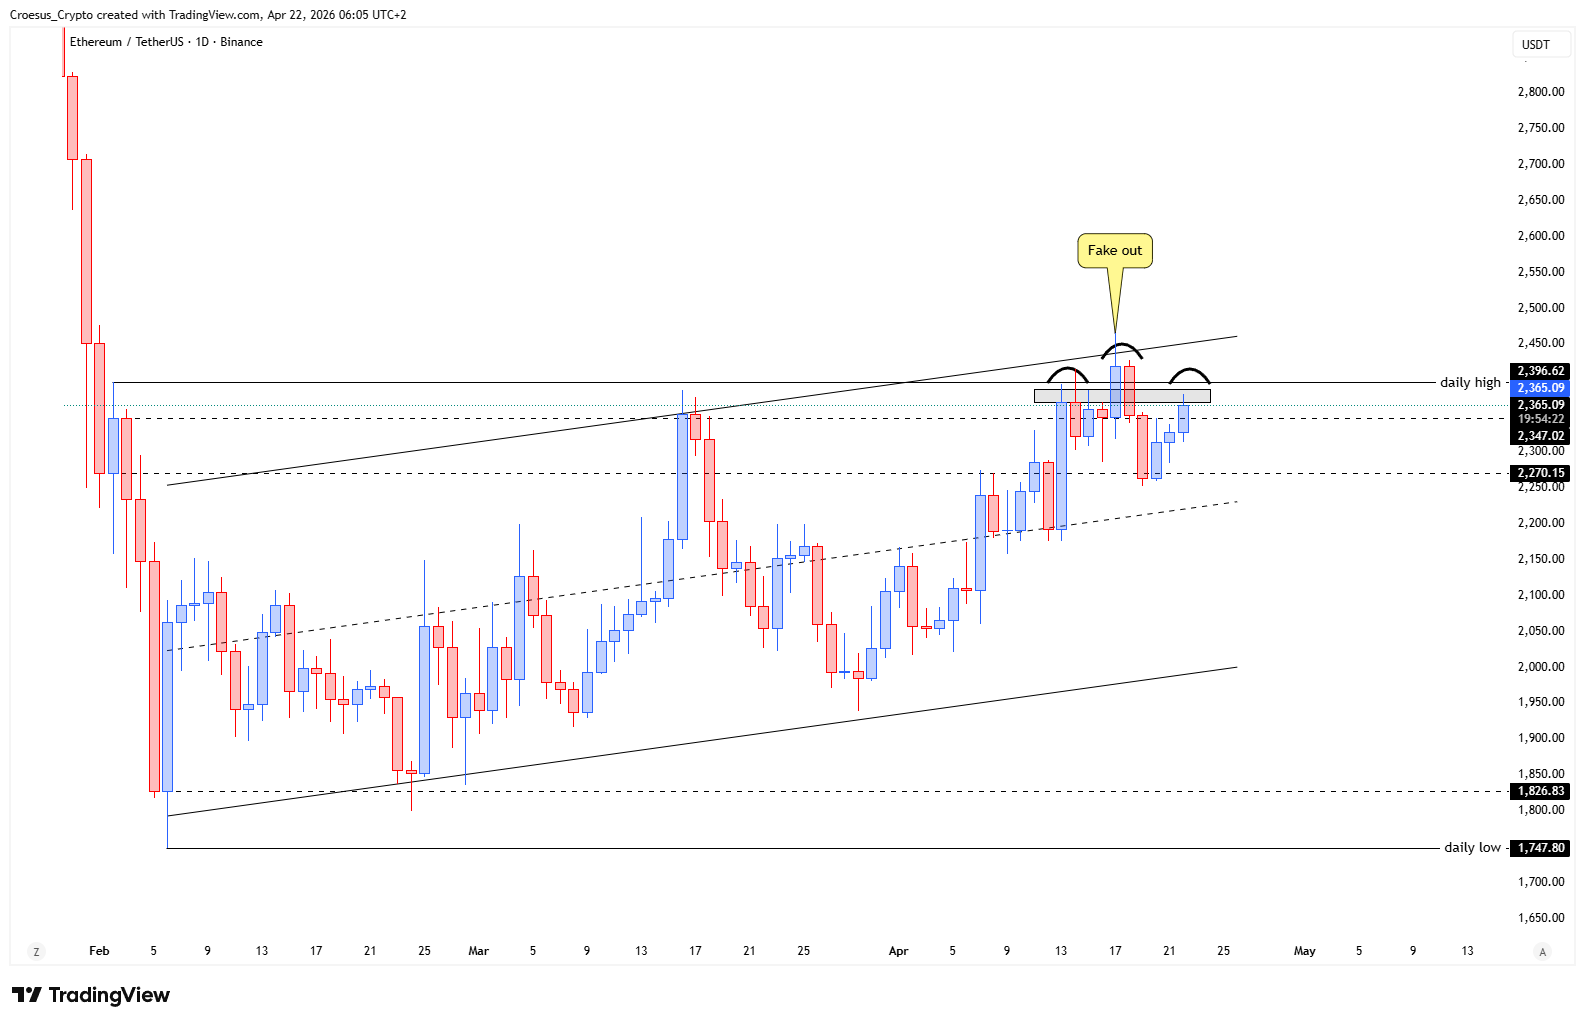
- The ETH price shows us that the price pushed back into the daily highs
- Although it needs to be confirmed we can potentially see a reversal pattern printing (head and shoulders). Within this pattern we can also still see a double top formation.
- Conditions remain the same : in order to be bullish and remain bullish we need to see a break and hold of the daily high (not a fake out).
Market Structure Analysis
From a market structure perspective, ETH is trading at a decision area because the daily highs act as a horizontal resistance zone where prior supply typically sits. The mention of a potentially printing head and shoulders, combined with a double top formation inside that structure, keeps the bearish thesis intact unless price proves otherwise.
In naked trading terms, this is about confirmation: a rejection from this resistance area supports continuation within the existing bearish structure, while acceptance above it would signal a shift in control. Until ETH can break and hold above the daily high, any push into that zone can still resolve as a fake out and liquidity sweep rather than a true reversal.
Key Levels and Scenarios
For this ETH daily analysis, the main split remains simple: sustained acceptance above the daily high is required to invalidate the immediate bearish bias; failure to hold that breakout keeps the current resistance as the pivot for downside continuation.
- Daily high: break and hold required for bullish acceptance (avoid a fake out)
- Head and shoulders structure zone: rejection here supports bearish continuation
- Double top resistance area: confirmation of seller control if price fails to reclaim highs
Trading Implications
Aggressive participants typically focus on whether the move into the daily highs is accepted (hold above) or rejected (failed breakout), while conservative participants often wait for clear confirmation via a break-and-hold or a clean rejection and continuation. In both cases, the daily high remains the key support resistance reference for risk framing.
This analysis is for informational purposes only and does not constitute financial advice.