


This ETH daily analysis for 22 December 2025 focuses on a market that remains in a bearish structure after a sharp sell-off. Our technical analysis highlights a completed head and shoulders with a confirmed break of structure, while a potential inverse head & shoulders (IHS) suggests a short-term corrective rally before bears may reassert control.
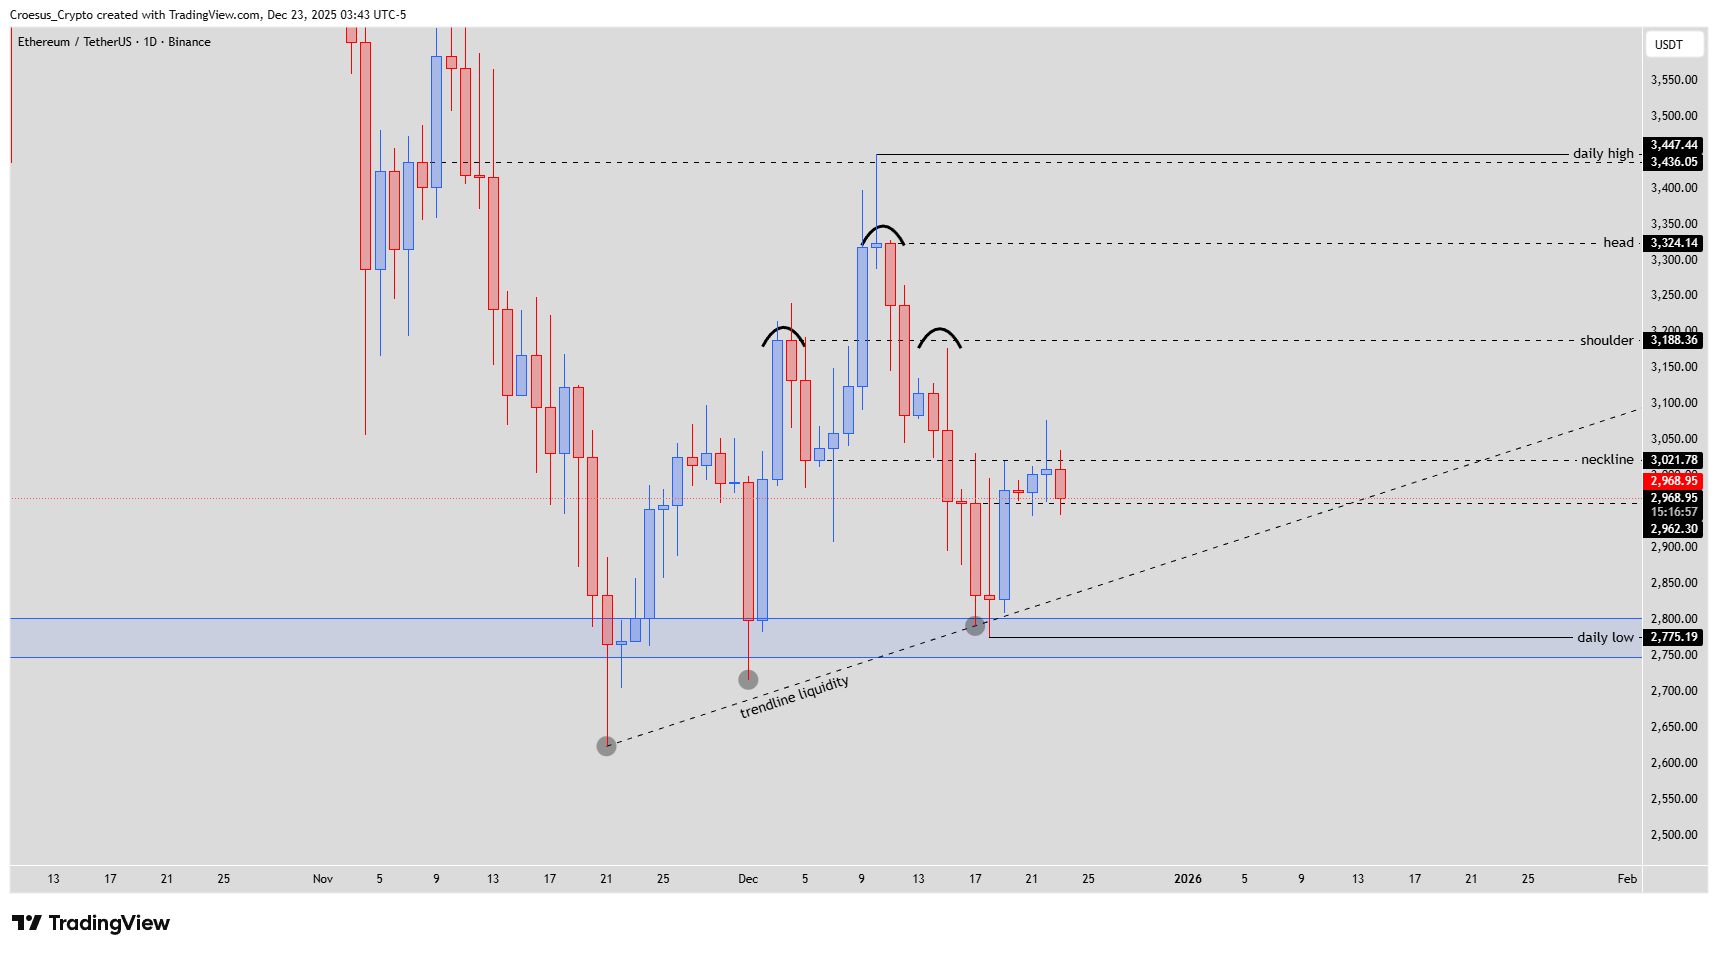
TH daily chart 23 Dec 2025 with head and shoulders structure, neckline and daily low liquidity zone.
Technical Analysis Key Points
- The price made a sharp sell-off creating a head and shoulder with break of structure (price closed below the neckline and even the swing low of that candle). This is a confirmation that bears are still very much in play.
- Same gameplay of the market makers as with BTC : on Friday, the last opening day of the stockmarkets, market makers pushed price impulsively, seducing retail in taking long positions.
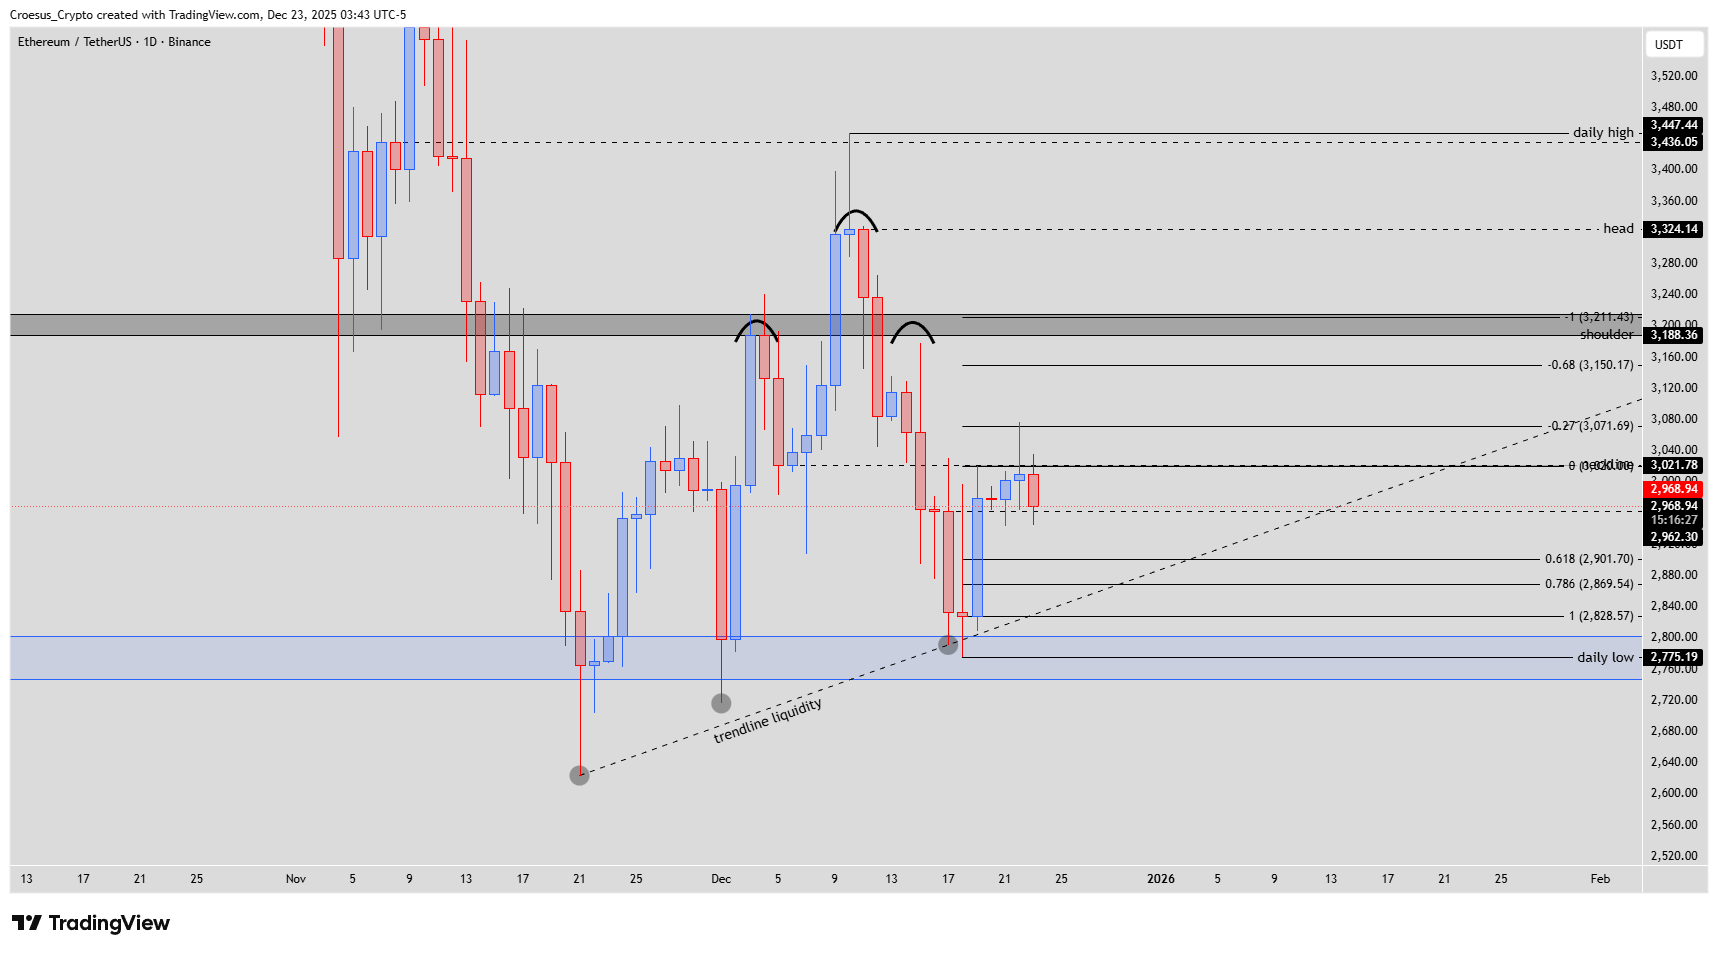
- At this moment we see a retest of shoulder structure of a possible inverse head and shoulders.
- If we take the fibonacci retracement from this IHS pattern, we can see that the -1 level is just above the shoulder of the bigger head and shoulder level.
- Therefore we can expect a retail driven "Santa Run" of 7%. But is this run sustainable ?
- We still have trendline liquidity resting below the current prices and we are still bearish (eventhough first time break).
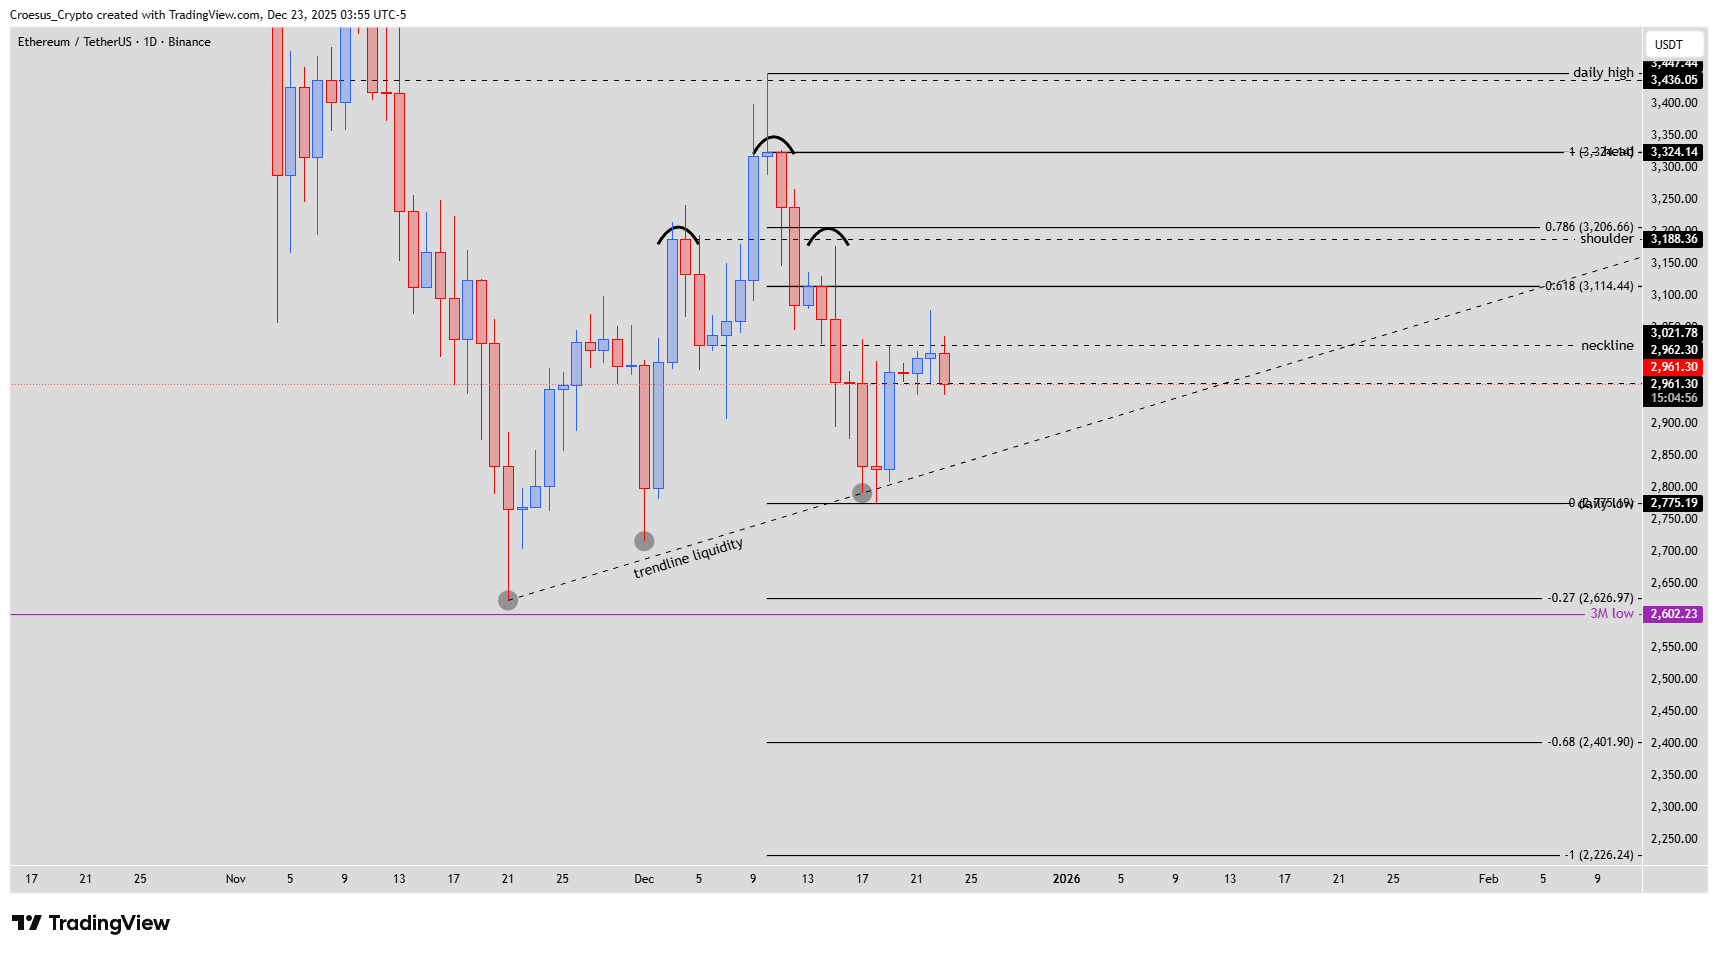
- We take a fib retracement of the bigger head and shoulders pattern, we can that the -0.27 level coincides with the 3M low. Could we still see a retest of the 3M low and a sweep of the trendline liquidity ?
Market Structure Analysis
ETH daily analysis shows price selling off aggressively from the 3,400–3,450 daily high and forming a clean head & shoulders pattern. The close below the neckline around 3,020 and even below the swing low confirms bearish control and a clear break of structure. Friday’s impulsive bounce, similar to BTC, looks like classic market-maker behaviour: pushing price higher into the last liquid session to draw retail into longs before the holiday lull.
Price is now retesting the former shoulder area near 3,180 as potential resistance while an IHS-like structure develops on lower lows. With the IHS Fibonacci retracement projecting the -1 extension just above this shoulder, a 7% “Santa Run” fits as a corrective move within a broader downtrend, not a confirmed reversal.
Key Levels and Scenarios
Bullish scenario: A retail-driven rally from roughly 2,960–3,000 (neckline area) toward 3,180–3,200 (shoulder and Fibonacci confluence) would complete the IHS idea. This would be a countertrend bounce unless ETH can reclaim the head zone near 3,325 and eventually the 3,446 daily high.
Key levels to watch :
2,775 – daily low; first major support and start of the broader demand zone.
Trendline liquidity zone ~2,700–2,750 – untapped liquidity that could attract a sweep.
≈2,960–3,020 – current neckline area for the IHS; must hold for any Santa Run.
3,180–3,200 – shoulder resistance and IHS target; aligns with local Fibonacci extensions.
≈2,600 (3M low / -0.27 Fib) – major downside magnet if the bigger H&S continues and trendline liquidity is hunted.
Trading Implications
This ETH daily analysis frames any 7% “Santa Run” as a high-risk, countertrend opportunity: aggressive traders may look for tactical longs from the neckline with tight risk below recent lows, while swing traders may prefer to wait for either a sweep of trendline liquidity near the 3M low or a convincing break above shoulder resistance before repositioning.
This content is for educational purposes only and is not financial advice or a recommendation to buy or sell any asset.