ETH Marketcap / Ethereum
ETH daily analysis 22/04/2026. Ethereum is pressing into the prior daily high area, creating a high-pressure inflection point where a breakout can either hold and shift structure, or fail and trap late buyers. Our technical analysis remains bearish while price action is still proving (or failing) acceptance above that key resistance.
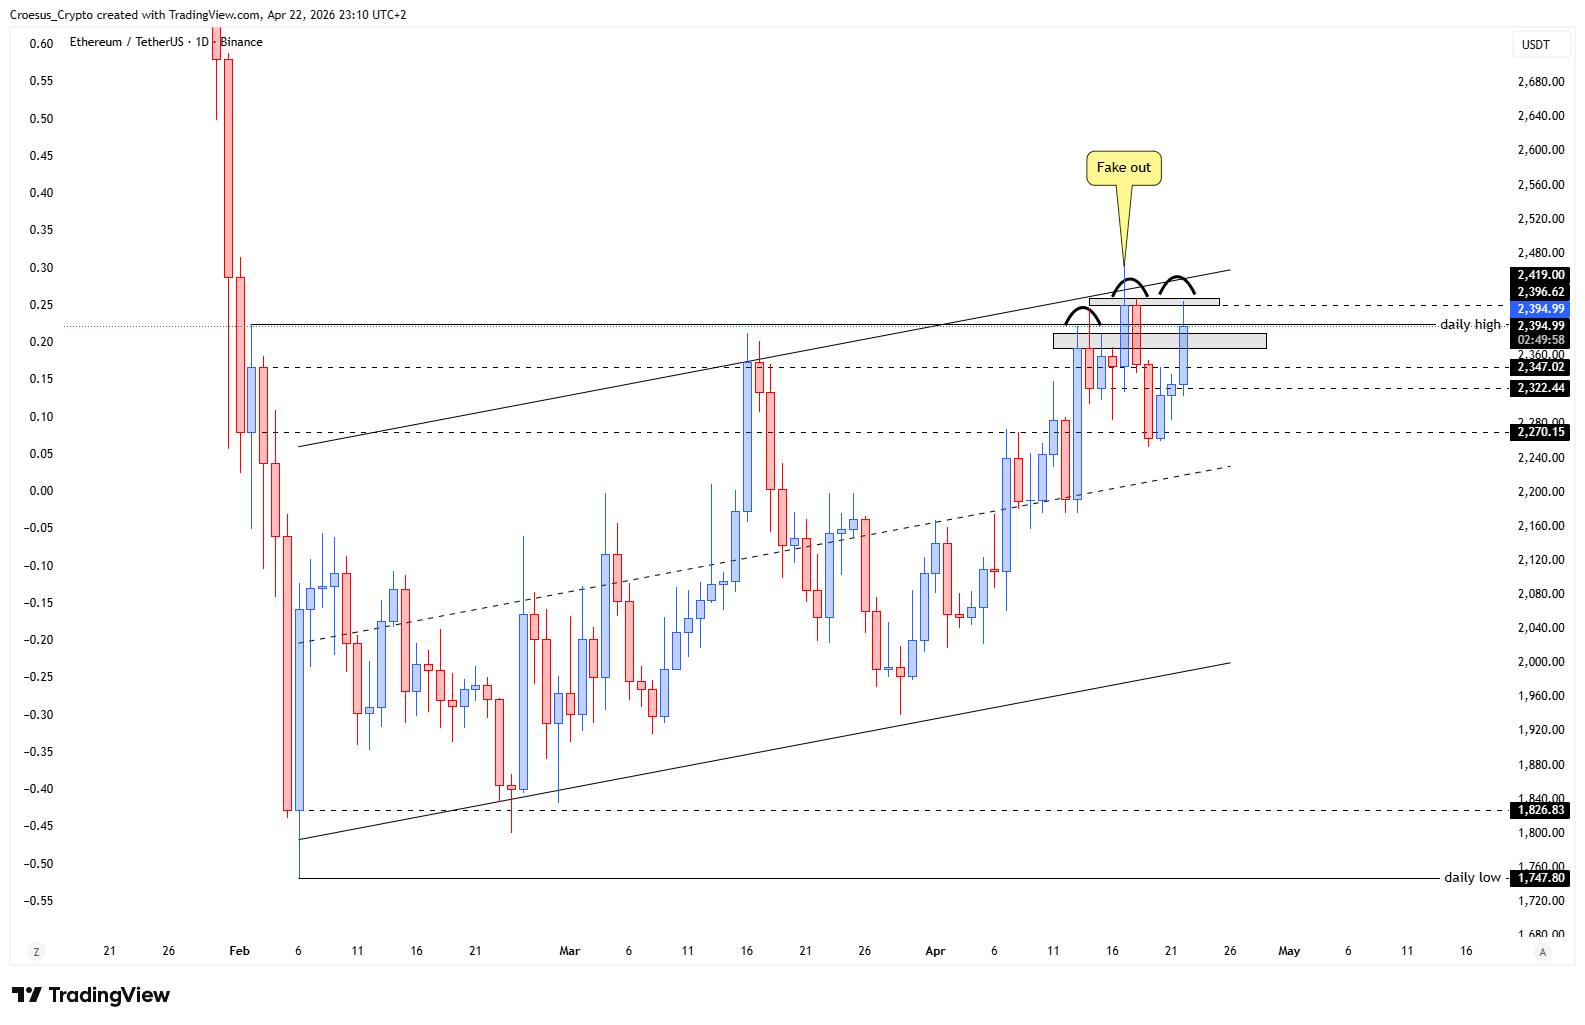
- The ETH price shows us that the price continued pushing high and keeps the pressure on the daily high.
- Eventhough we did not change daily high on the chart yet (due to the fake out), the daily high did shift higher. We have seen a first time break, we just did not see a hold above yet.
- This candle isn't closed yet, and with the price past the prior daily high, a lot of retail traders are experiencing some FOMO. But isn't that what market makers want ? Entice as much as retail traders as they possibly can. And surprise them in the act.
- We remain bearish until proven otherwise.
Market Structure Analysis
From a market structure perspective, ETH is testing a key horizontal resistance: the prior daily high. The “first time break” without a clear hold above is critical, because it often reflects a liquidity event rather than a confirmed break of structure. In other words, price can briefly trade above resistance, pull in breakout buyers (FOMO), and then rotate back below the level—turning that area into a rejection zone and confirming that sellers still defend the range high. Until we see acceptance above the prior daily high (a close and follow-through that holds), our ETH daily analysis treats the current push as pressure into resistance within a bearish context, with support resistance dynamics still favouring a potential trap-and-reversal.
Key Levels and Scenarios
The bullish path requires a clean hold above the prior daily high after the candle closes, signalling acceptance and reducing the probability of a fake out. The bearish path strengthens if price fails to hold above that level and rotates back below it, confirming rejection and keeping downside continuation on the table.
- Prior daily high: primary resistance; acceptance vs rejection level
- Current daily high area: liquidity zone where fake outs can form
- Break-and-hold region above the prior high: confirmation zone for bulls
- Back below the prior daily high: bearish validation area if rejection is confirmed
Trading Implications
In this ETH daily analysis, aggressive participants typically wait for clear confirmation (acceptance above resistance or rejection back below it), while conservative traders often prioritise candle closes and follow-through to avoid being caught in stop-driven volatility around obvious highs.
This analysis is for informational purposes only and does not constitute financial advice.