


Ethereum daily analysis for 23 December 2025 shows ETH reacting after a swing failure pattern, followed by a sharp impulsive sell-off into lower structure. While price has since bounced from a shoulder-level support area, the overall structure remains fragile and does not yet present a clean, high-quality long setup.
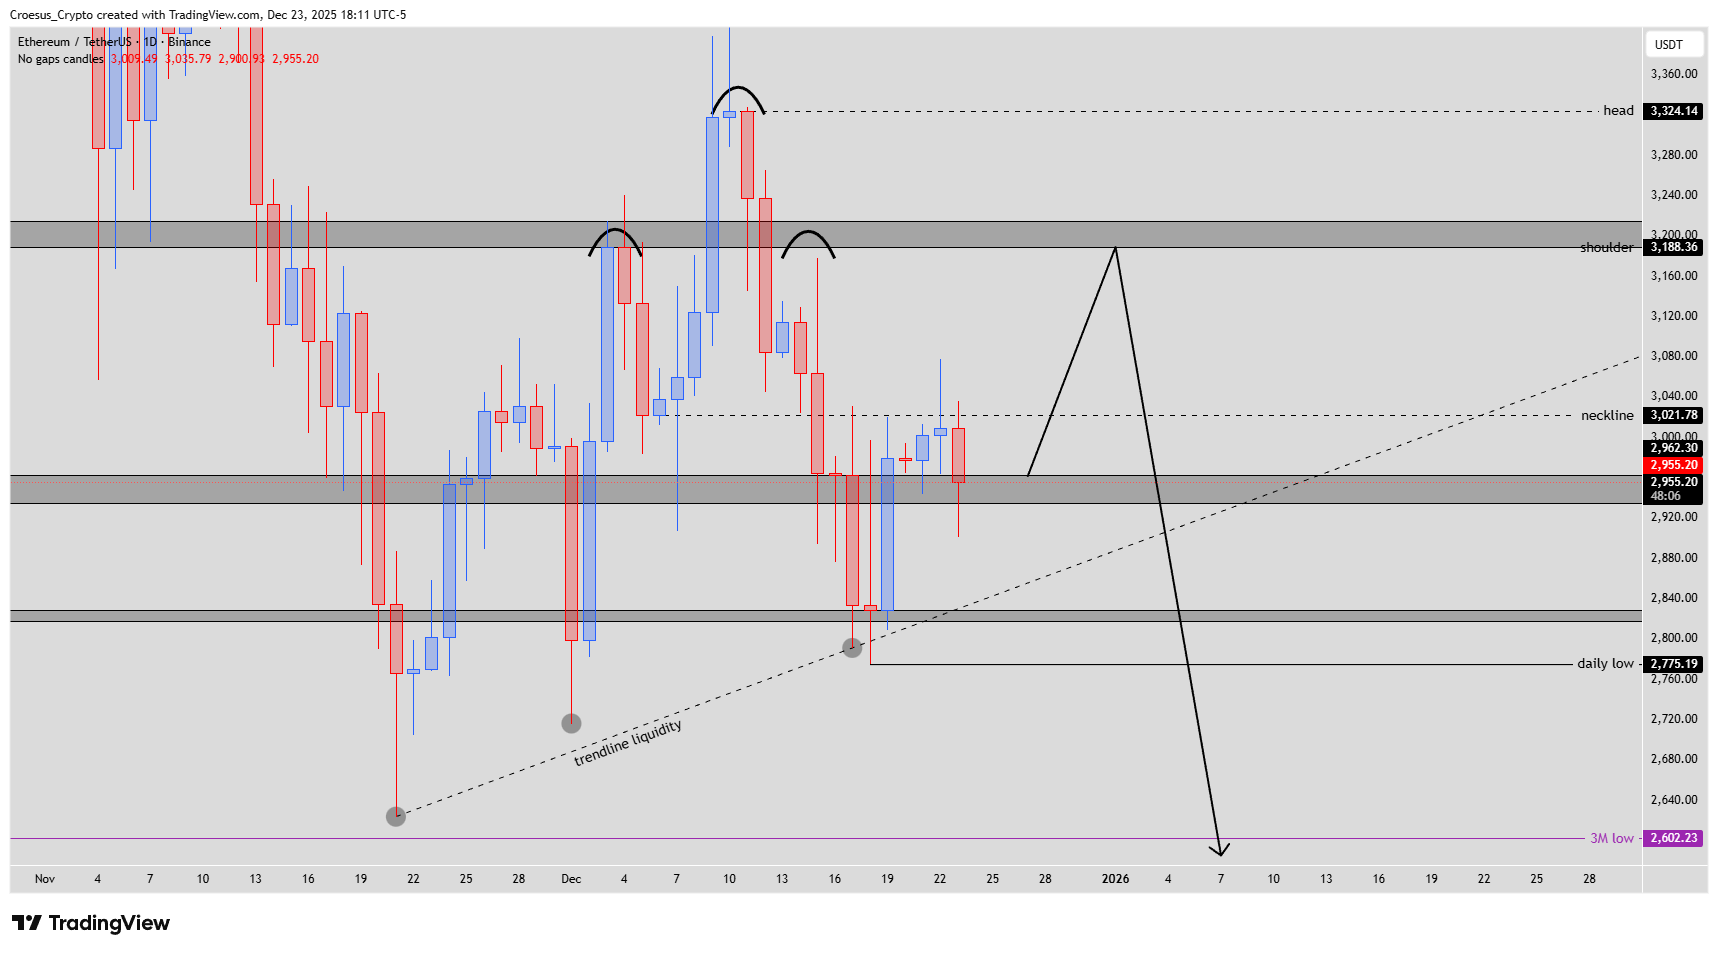
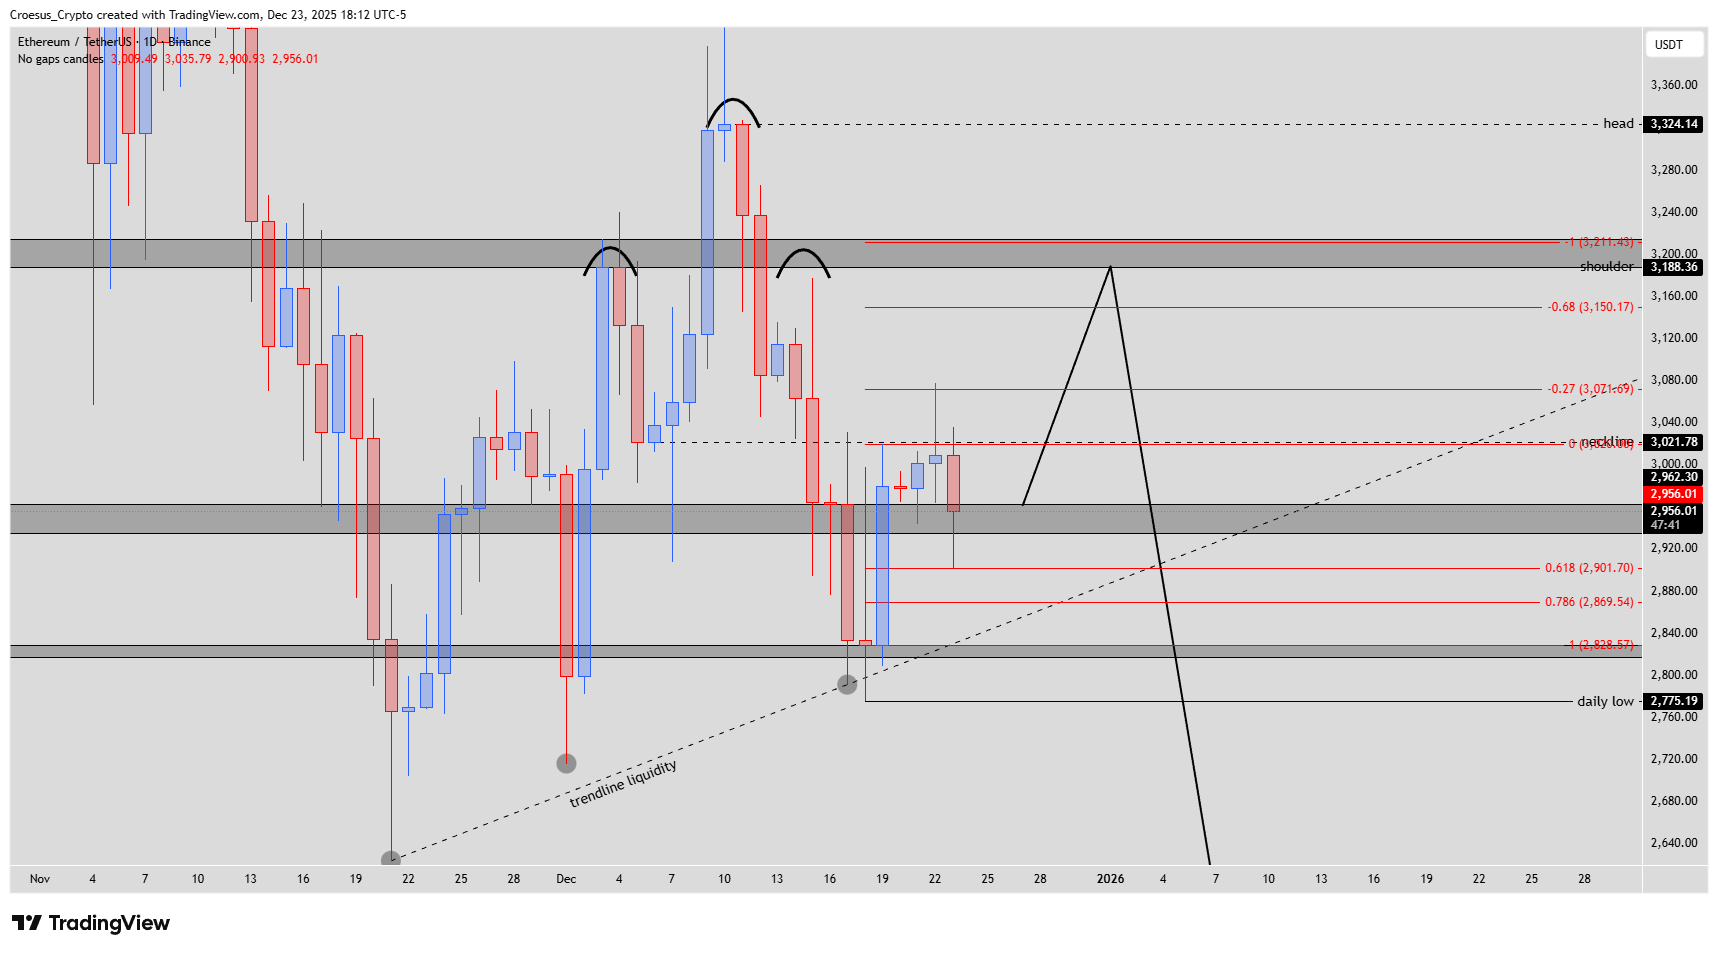
ETH daily chart 23 December 2025 highlighting weak inverse head and shoulders structure and risk toward local lows
Technical Analysis Key Points
- After seeing a swing failure pattern yesterday, the price made a strong sell-off, correcting until a shoulder level.
- Personally, I don't like this structure, because the distance from the head until the shoulder is too far and gives us not enough risk to reward.
- Eventhough we saw a retest of a possible daily entry zone, I would like see a strong reversal pattern on the 4H chart (no deceleration) before entering a long position.
- If not the risk of retesting the local lows is too big.
Market Structure Analysis
From a market structure standpoint, ETH remains bearish on the daily timeframe. The current price action can be interpreted as a developing inverse head and shoulders, but the structure lacks symmetry and efficiency. The distance between the head and shoulder is excessive, reducing the potential risk-to-reward profile for any countertrend long attempt.
The recent bounce occurred after a decisive sell-off, suggesting liquidation rather than accumulation. Without a sharp and impulsive reversal, this move risks being nothing more than a corrective pause before continuation lower. The nearby neckline region around $3,020–$3,040 remains unclaimed, while overhead resistance at the shoulder zone near $3,188 caps upside for now.
Key Levels and Scenarios
Bullish reaction scenario: Only valid if ETH prints a strong, impulsive reversal on the 4H timeframe from the current zone, targeting $3,020 first and potentially $3,150–$3,190 as a reactionary move.
Bearish continuation risk: Failure to produce momentum on lower timeframes keeps the risk open for a move back toward $2,840–$2,775, and potentially a deeper extension if selling pressure returns.
Critical levels to watch
$3,324: Prior head / major resistance
$3,188: Shoulder resistance
$3,021: Neckline / first upside reaction level
$2,900–2,840: Key support band
$2,775: Daily low / downside trigger
Trading Implications
From a trading perspective, this setup remains unattractive from a risk-to-reward standpoint. Although a possible daily entry zone was retested, no position should be considered without a strong 4H reversal pattern, characterized by impulsive buying and a lack of deceleration. Any long exposure here would be countertrend, as the prevailing daily structure remains bearish. Without confirmation, the probability of a retest of local lows is too high, making patience and selectivity critical.
This content is for educational purposes only and is not financial advice or a recommendation to buy or sell any asset.