


ETH Marketcap / Ethereum
In this ETH daily analysis for 23 February 2026, Ethereum continues to trade lower inside a clear corrective structure after the sharp early-month sell-off. Our technical analysis still treats the move as an ABC correction, with price pressing into the lower range where the daily low and Fibonacci confluence become critical for the next directional move.
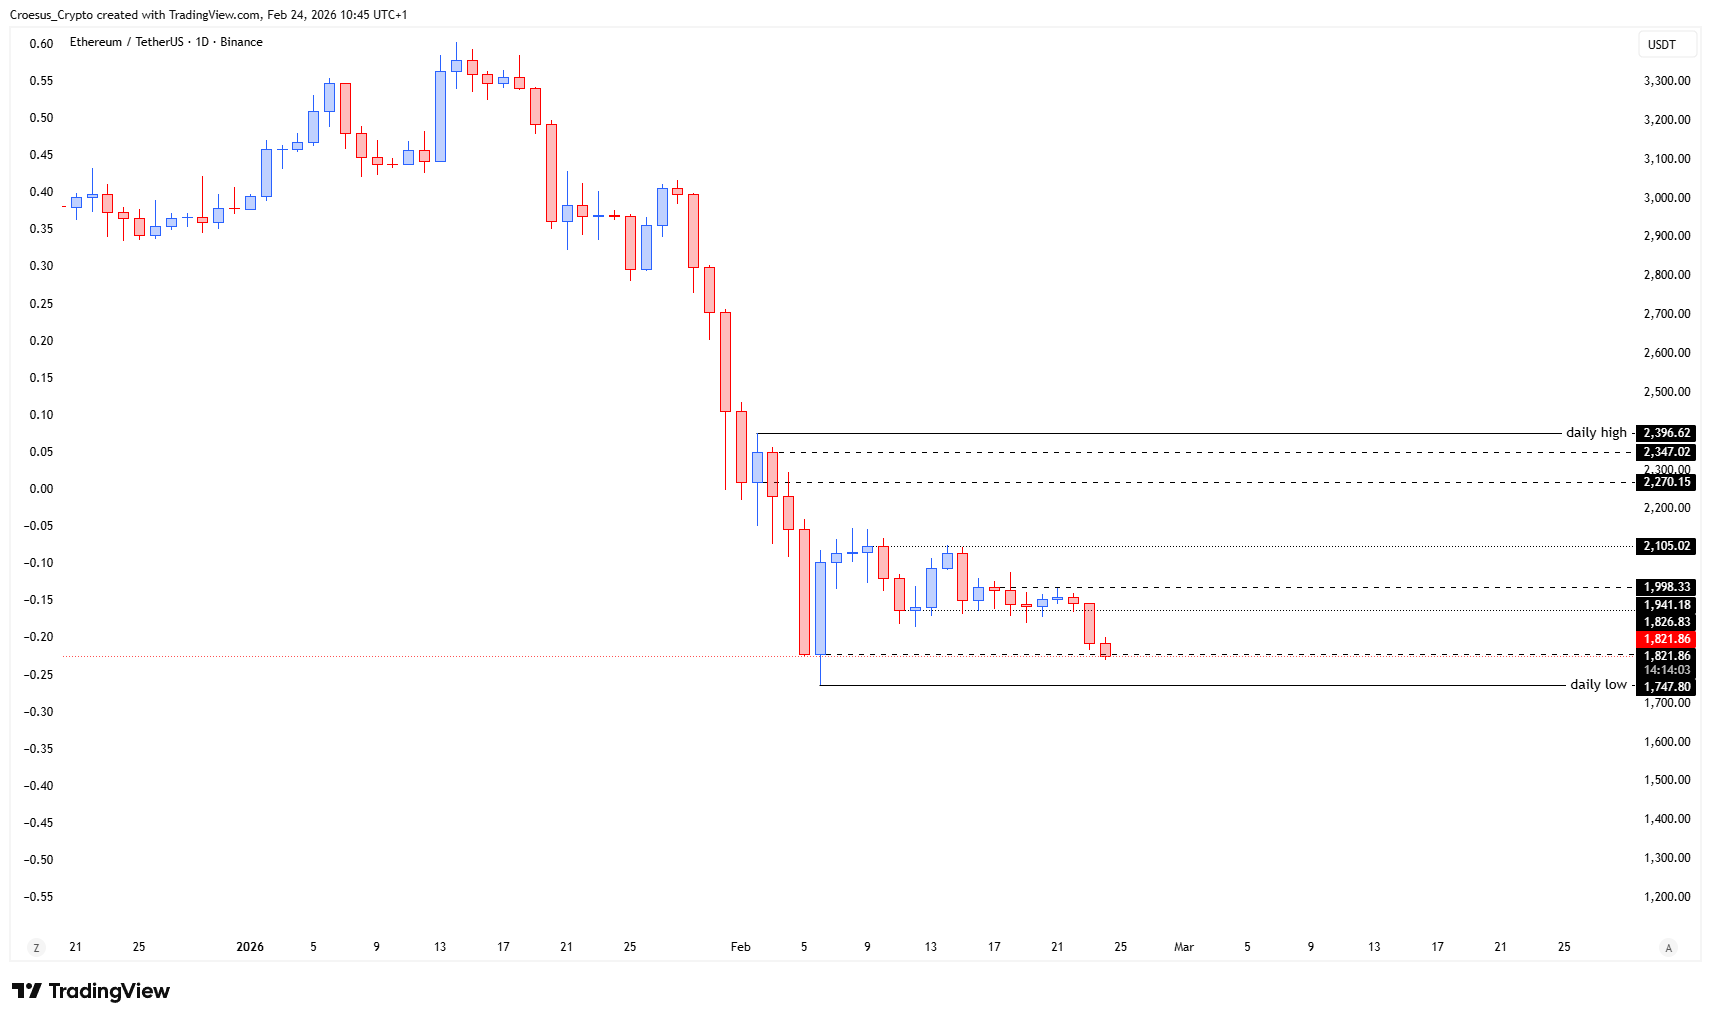
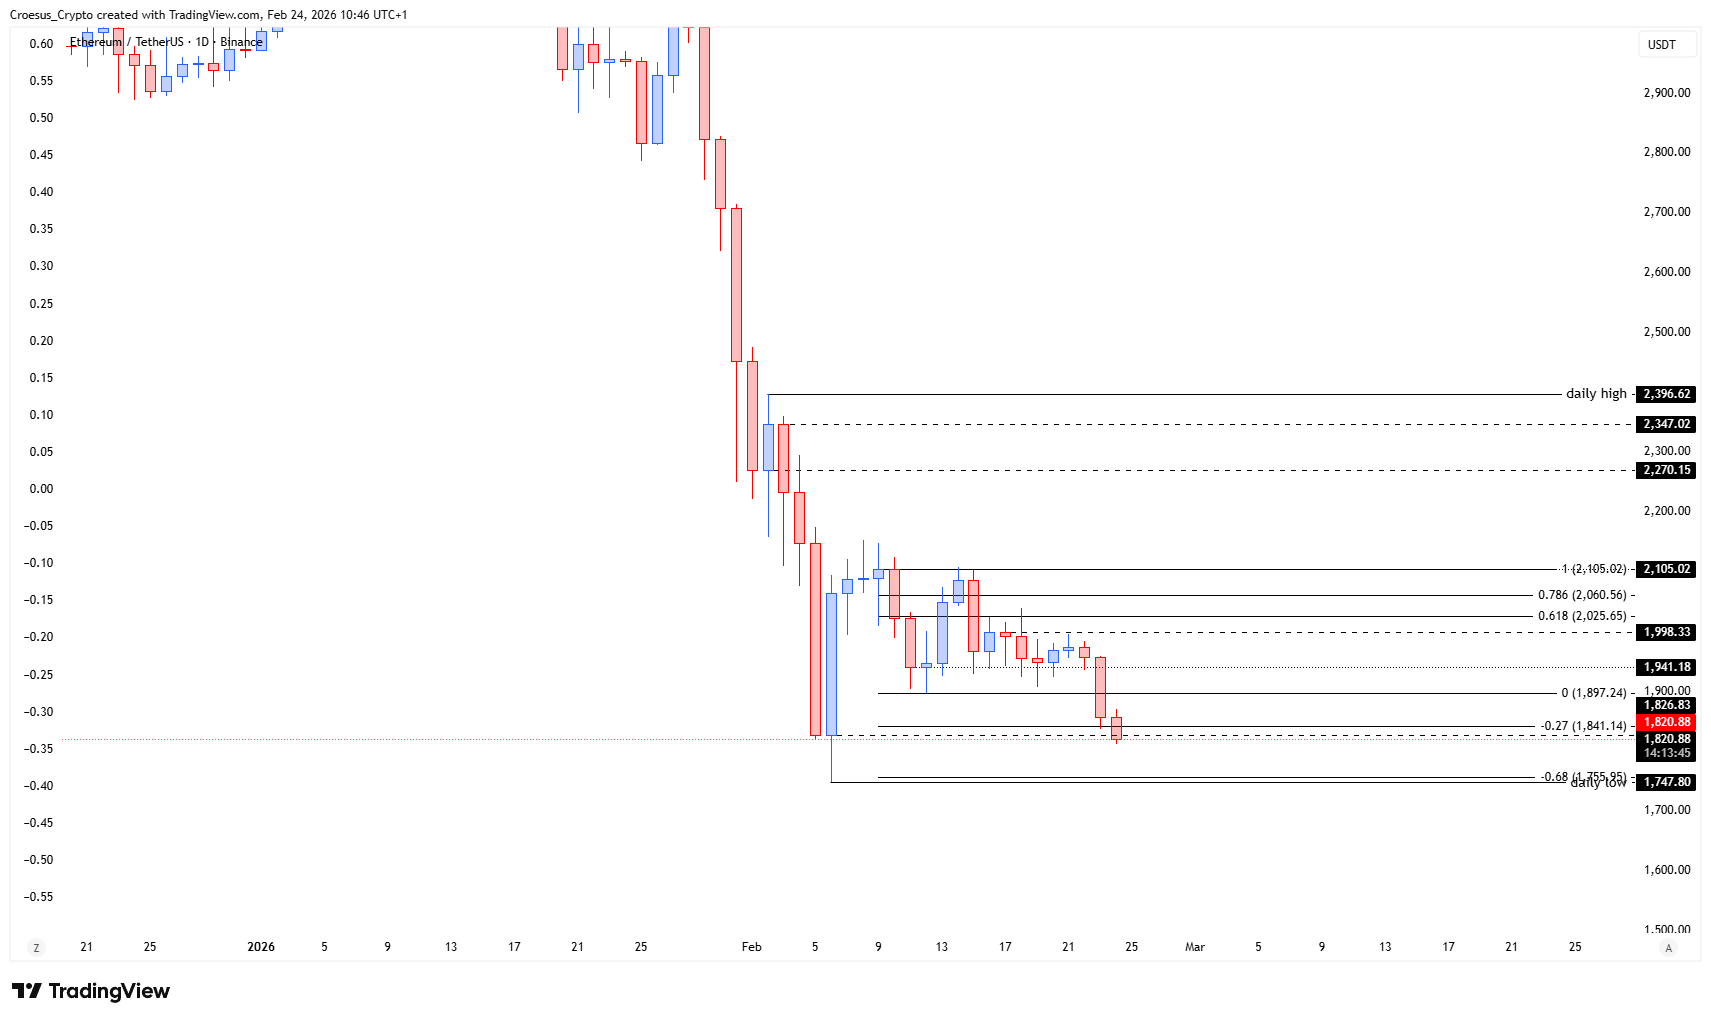
- ETH is showing us further bearish rejection.
- But the ABC correction is still in play. As long as the daily low does not get broken (close below), the set-up remains valid. There is also a confluence with the fib -0.68 level, so a sweep of the low is most likely.
Market Structure Analysis
Structurally, ETH remains in a grinding downtrend inside the corrective box, printing lower highs while respecting the same downside boundary. That daily low marks the current “line in the sand”: as long as Ethereum holds above it on a closing basis, the ABC correction scenario remains the dominant read rather than a fresh impulsive leg down.
The fact that this low aligns closely with the -0.68 Fibonacci extension strengthens the area as both technical support and a liquidity magnet. A brief sweep below the low followed by strong absorption would fit well with an accumulation of stop orders, potentially completing the C-leg and offering a springboard for a corrective bounce back into the mid-range resistance band.
Key Levels and Scenarios
In the bullish scenario, we look for a stop-run through or into the daily low/Fibonacci cluster, followed by a sharp reclaim of that level. That would open room for a move back toward intermediate resistance levels around the prior consolidation highs and the 2,100–2,300 USDT zone, where support resistance flips and further selling pressure are expected.
Critical levels to watch:
- $1,747 (daily low) – Primary downside invalidation; loss suggests the C-leg is starting.
- 1,775–1,826 – Short-term support and pivot; holding here keeps the B-leg thesis alive.
- 2,100 – Mid-range resistance and first objective for any bounce.
- 2,270–2,347 – Major resistance cluster, ideal zone to monitor for B-leg exhaustion
- 2,396 (daily high) – Key macro resistance; only a sustained break would weaken the broader bearish structure.
Trading Implications
For active traders, patience around the low/Fibonacci confluence is crucial; waiting for a clear reaction there can improve reward-to-risk, while a confirmed close below the daily low would argue for de-risking long exposure and reassessing the broader structure.
This analysis is for informational purposes only and does not constitute financial advice.