


ETH Marketcap / Ethereum
ETH daily analysis 26/02/2026. Ethereum is still labeled bearish, but our ETH daily analysis shows a potential momentum shift after a key Fibonacci reaction, with price now stalling around a major reversal structure.
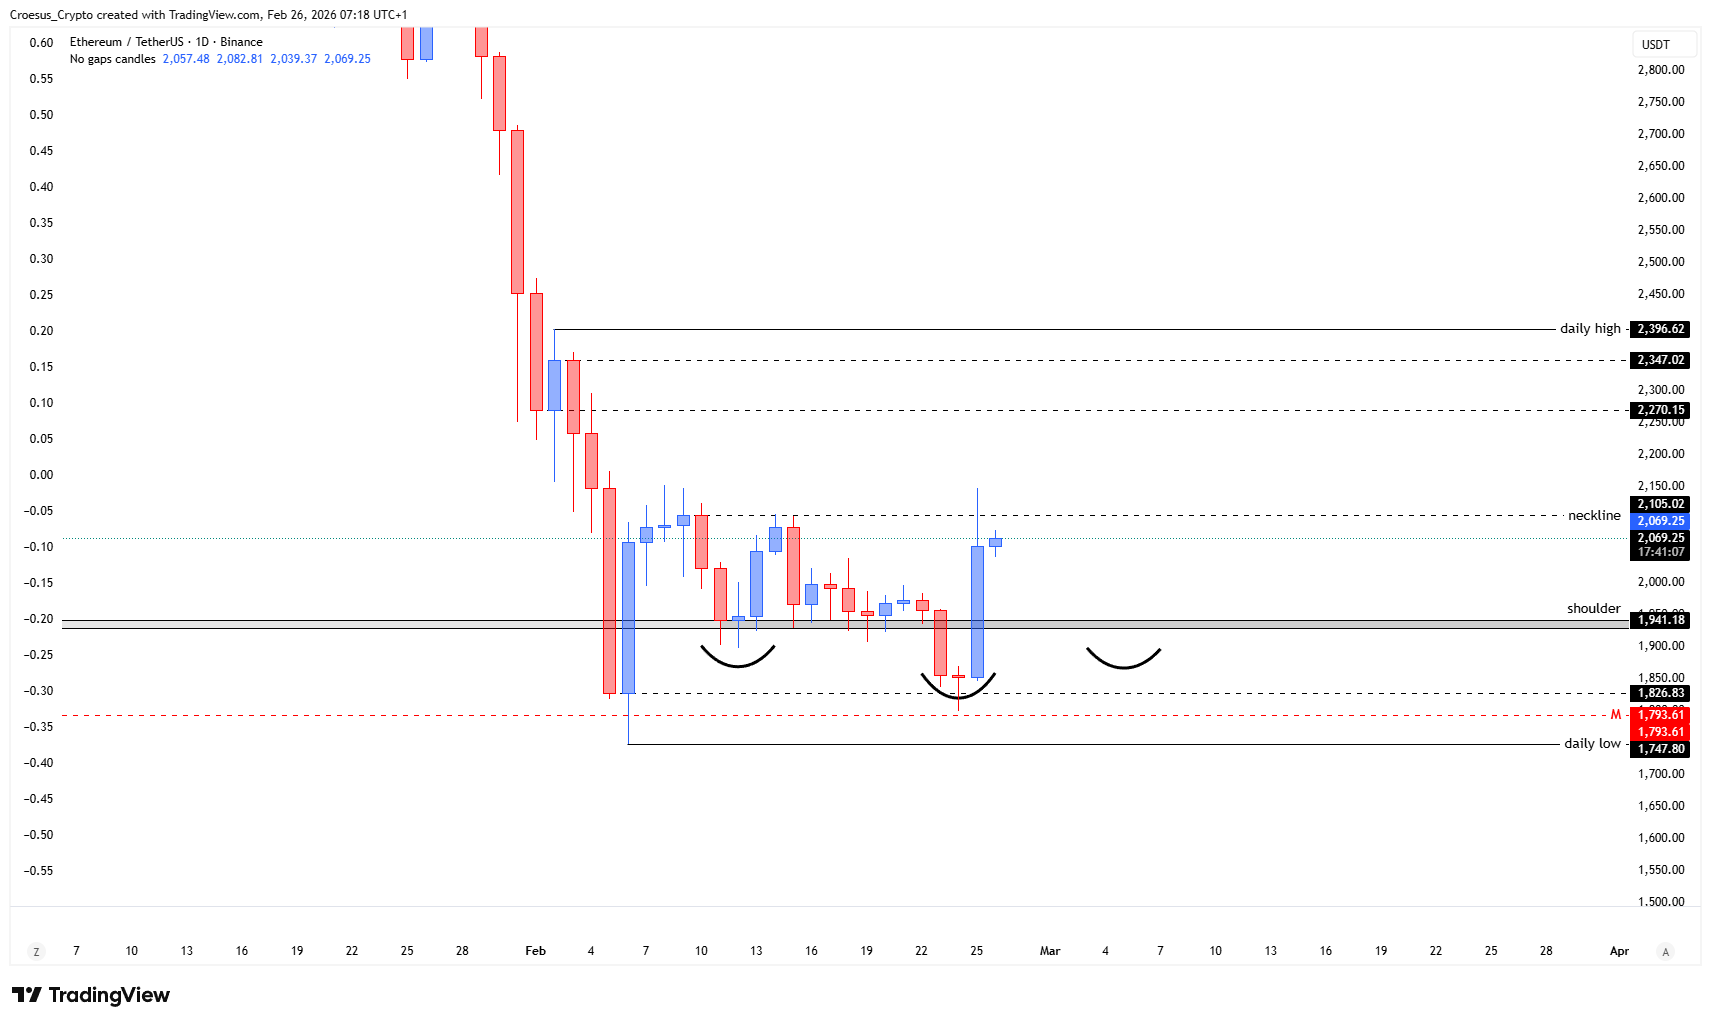
- after tapping the fib 100% level, ETH showed us a clear switch of momentum.
- We can clearly see the formation of a reversal pattern : an inversed head & shoulders, with the first retest being the shoulder level and the second retest acting as the head.
- At this moment we saw the price piercing the neckline but being stopped there.
- We could see two scenario's playing out : either we see a bullish continuation, giving us a iHS with break of structure. Or we could see the price making a pullback towards the shoulder level (printing the right shoulder) or even towards the head (giving us a double bottom).
- Although not as present as with TOTAL and BTC, we still can see some liquidity resting below the recent swing low. A retest of the monthly level is still possible, even a sweep below the daily low @ 1.747,80 $
Market Structure Analysis
From a market structure perspective, the rejection after tapping the fib 100% level signals a potential transition from impulsive downside to a corrective basing process.
The developing inversed head & shoulders frames a classic reversal attempt: left shoulder and head are already defined by the two retests, while the neckline is now acting as an immediate decision zone after price “pierced” it but failed to follow through.
In our ETH daily analysis, that kind of failed acceptance at the neckline often means the market is still hunting liquidity and needs more structure (either a clean break of structure to confirm reversal, or a deeper pullback to build the right shoulder/double bottom).
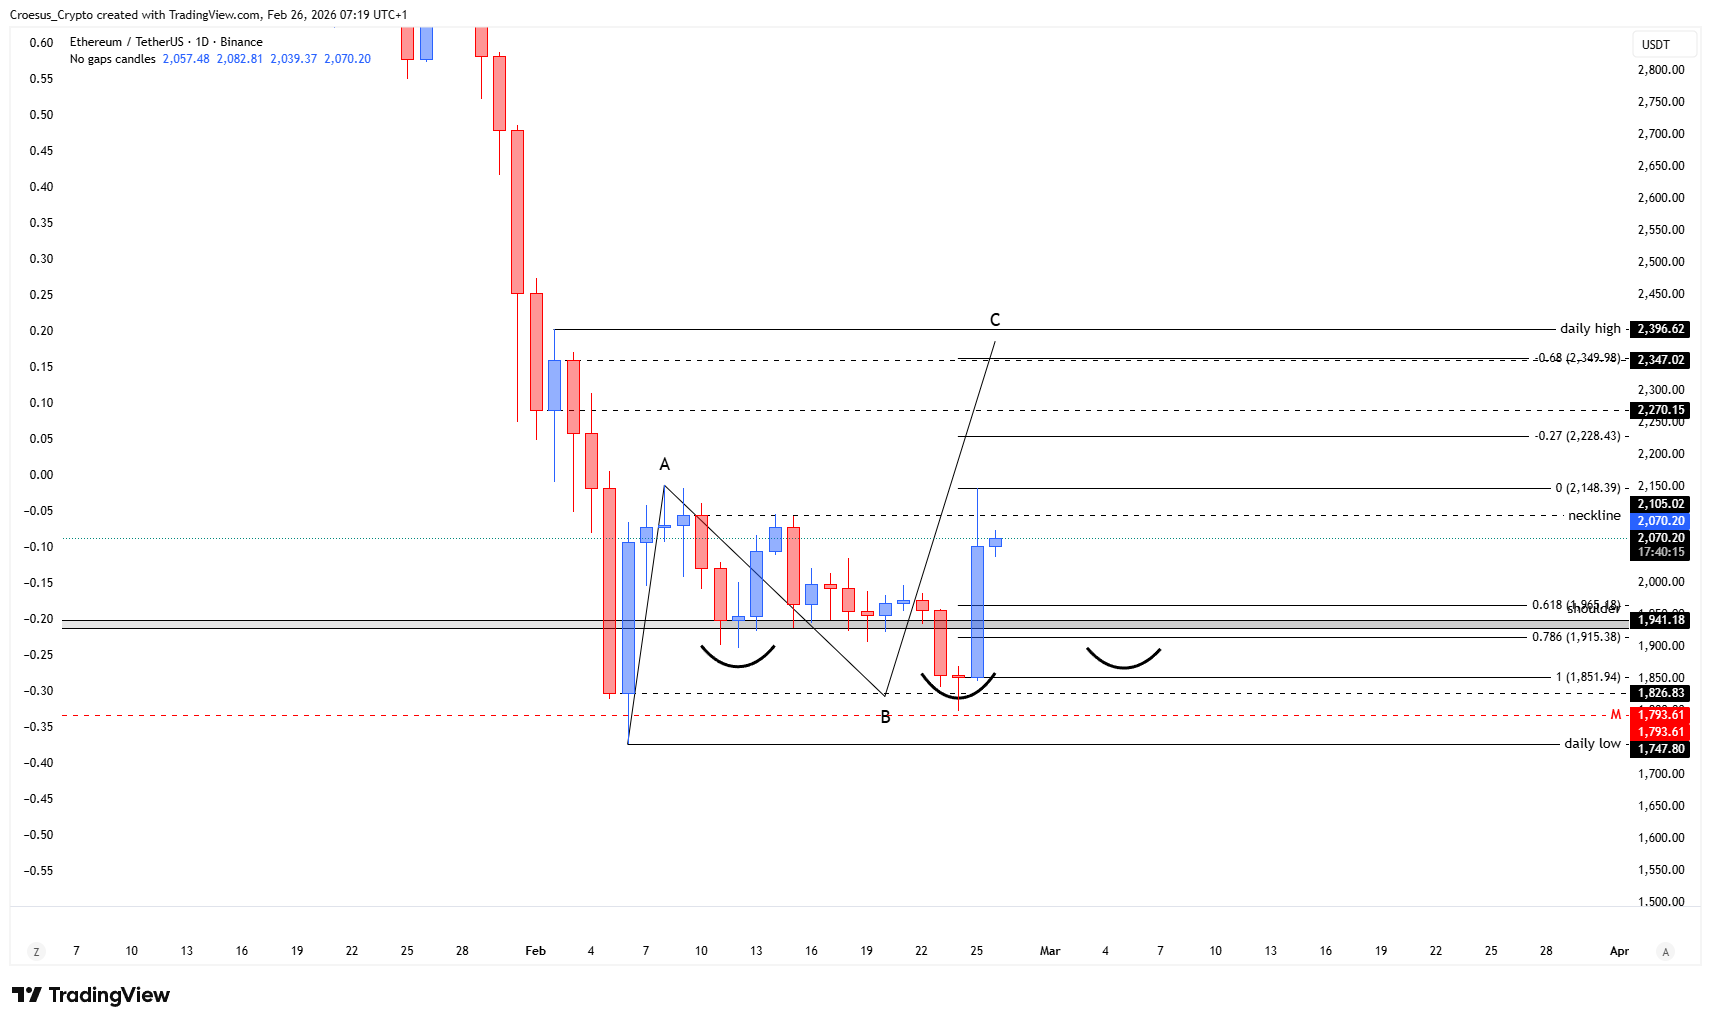
Key Levels and Scenarios
Bullish continuation requires a decisive reclaim and hold above the neckline, followed by a clear break of structure that confirms the iHS reversal attempt. The alternative bearish/corrective scenario keeps price rotating lower to fill unfinished structure, with liquidity draw risk below the recent swing low and a possible sweep toward $1.747,80 before any sustainable reversal. This ETH daily analysis stays focused on support resistance behavior around the neckline and the prior retest zones.
- Neckline zone as the main resistance/trigger area for confirmation
- Shoulder level as the higher-low support zone if the right shoulder prints
- Head/double-bottom area as the deeper structural retest zone if weakness persists
- $1.747,80 as the daily low sweep level tied to nearby liquidity
This analysis is for informational purposes only and does not constitute financial advice.