


n this ETH daily analysis for late November 2025 we focus on today’s sharp intraday reversal after a continued bearish sequence. Our technical analysis highlights how buyers defended a fair value gap before price rotated back up toward short-term resistance, while the broader structure remains corrective within a downtrend.
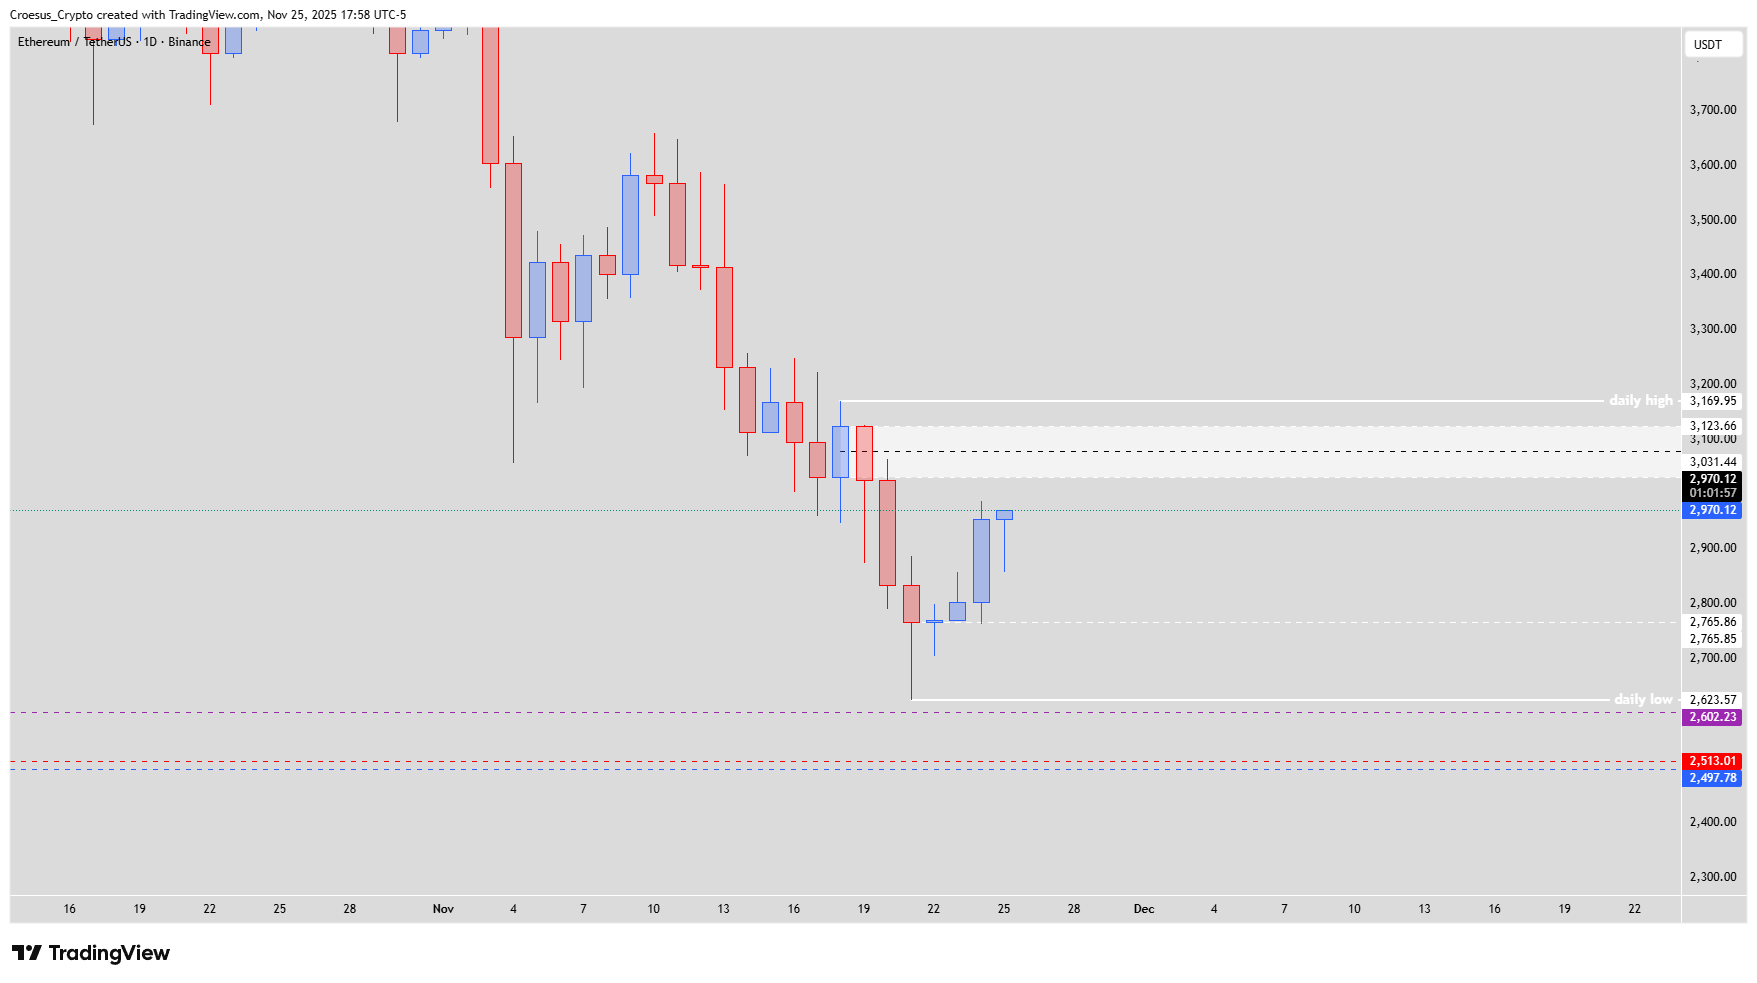
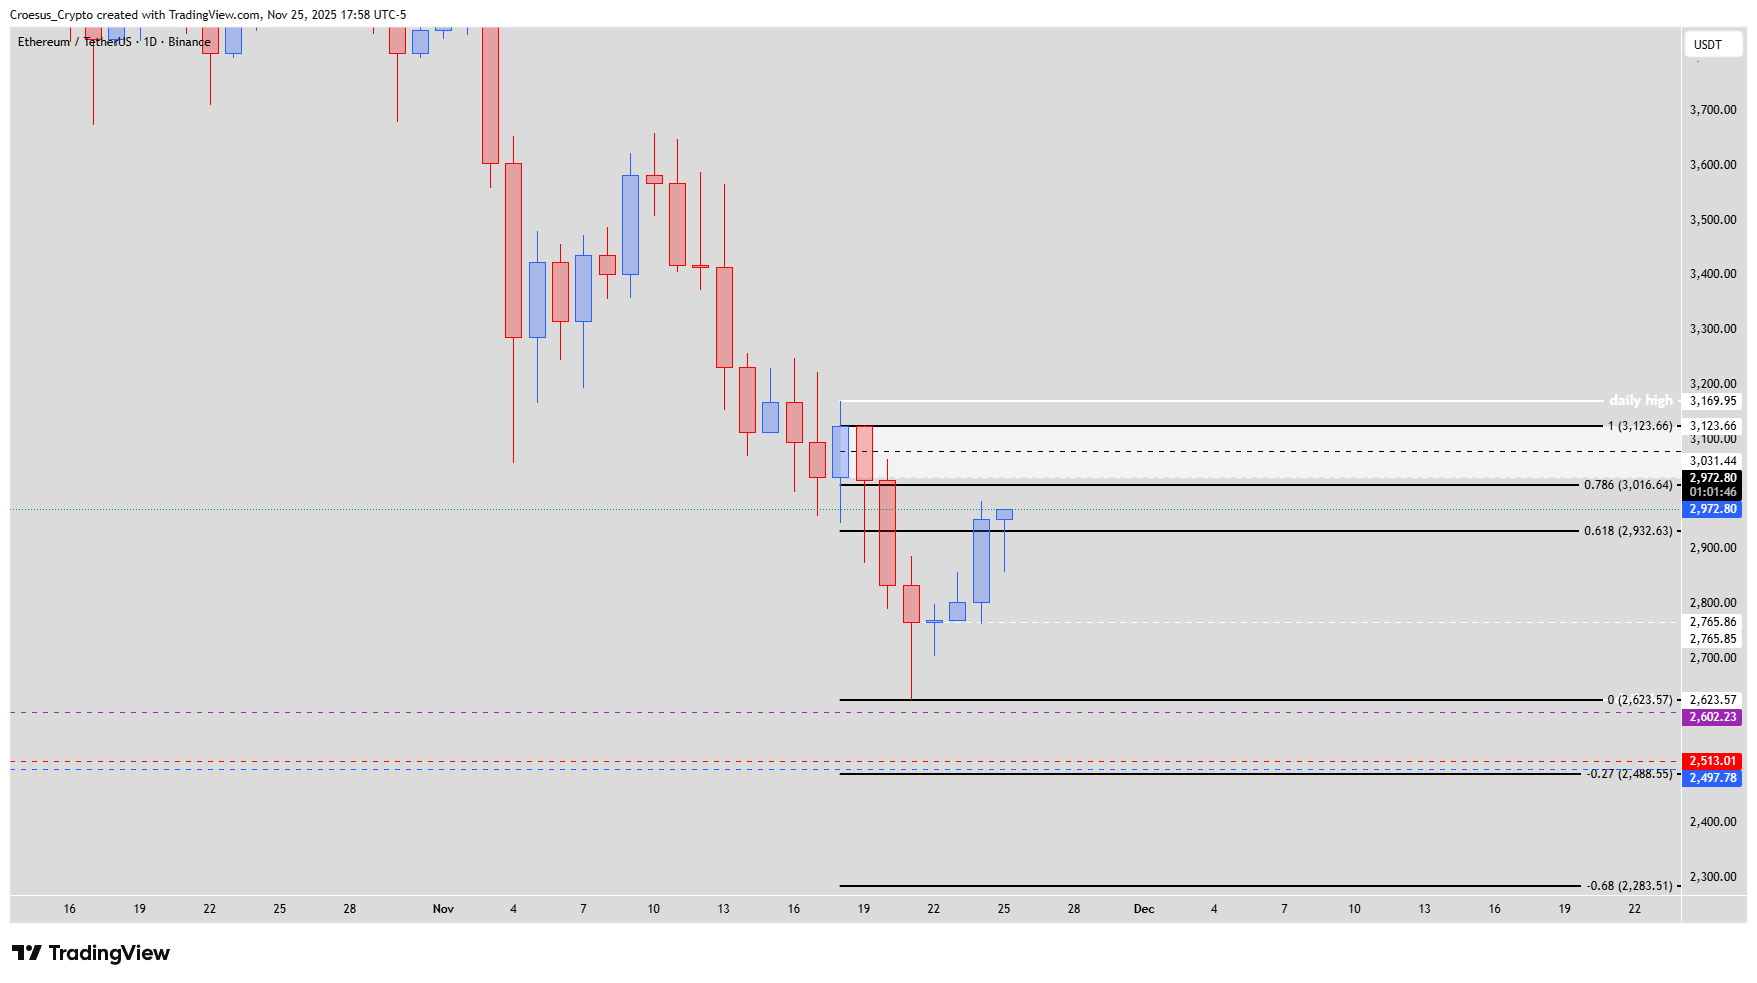
ETH daily chart 25 Nov 2025 with fair value gap fill, long lower wick and Fibonacci -0.27 confluence near the 3,000 $ zone.
Trend = bearish ↓
Technical Analysis Key Points
- Price started the day with retracing and filling the fairvalue gap touching the wick created by the candle of the day before yesterday.
- But this has been bought back during the NY session, printing a large wick, showing buying power for the bulls.
- This bullish reversal might seem to be impulsive, but still needs to be considered as a bullish correction of the last bearish push down
- In order to see a bullish reversal the daily high @ 3,169.95 $ needs to be reclaimed and defended.
- A retest of the zone around 3,000 $ seems more than likely, possibly initiating a further bearish continuation. If we look at the fib retracement of this bearish W, we can see that the fib completion -0.27 not only is confluent with a weekly key level but also a monthly and 3monthly key level.
Market Structure Analysis
Our ETH daily analysis still treats the market as being in a dominant bearish leg, with today’s move classed as a bullish correction. Price first traded lower to fill the prior fair value gap and tag yesterday’s wick, then was aggressively bought back during the New York session, leaving a pronounced lower shadow that signals short-term buying interest.
However, without a break of market structure, this remains a corrective bounce into resistance. The 3,000 $ zone lines up with a key support resistance flip and the -0.27 Fibonacci completion of the recent bearish swing, which also aligns with important weekly, monthly and 3-monthly levels, adding notable higher-timeframe confluence in our Fibonacci-based technical analysis.
Key Levels and Scenarios
A constructive bullish scenario requires ETH to reclaim and hold above the 3,169.95 $ daily high, turning that level into support and confirming a more sustainable trend shift. Failing that, the most probable path is a retest of the 3,000 $ region, where we monitor for bearish reaction and potential continuation of the broader downtrend.
Key levels to watch:
3,169.95 $ – Daily high: reclaim and defense needed for a confirmed bullish reversal.
3,000 $ – Retest zone: major support resistance area and focus of the current corrective move.
Fair value gap low / prior wick: intraday demand area that sparked today’s reversal.
Fib -0.27 completion zone: strong multi-timeframe confluence that could cap further upside.
Trading Implications
For now, traders may treat this ETH daily analysis as a playbook for a corrective rally into 3,000 $–3,169.95 $, looking for rejection or confirmation around these levels while sizing positions conservatively relative to volatility and individual risk.
This publication is for educational purposes only and does not constitute financial advice or a recommendation to buy or sell any asset.