


In this Ethereum daily analysis for late November 2025, we track an aggressive bounce inside a broader bearish structure. Our technical analysis focuses on the ABC corrective leg, key Fibonacci reaction zones and nearby support resistance levels that can define the next move.
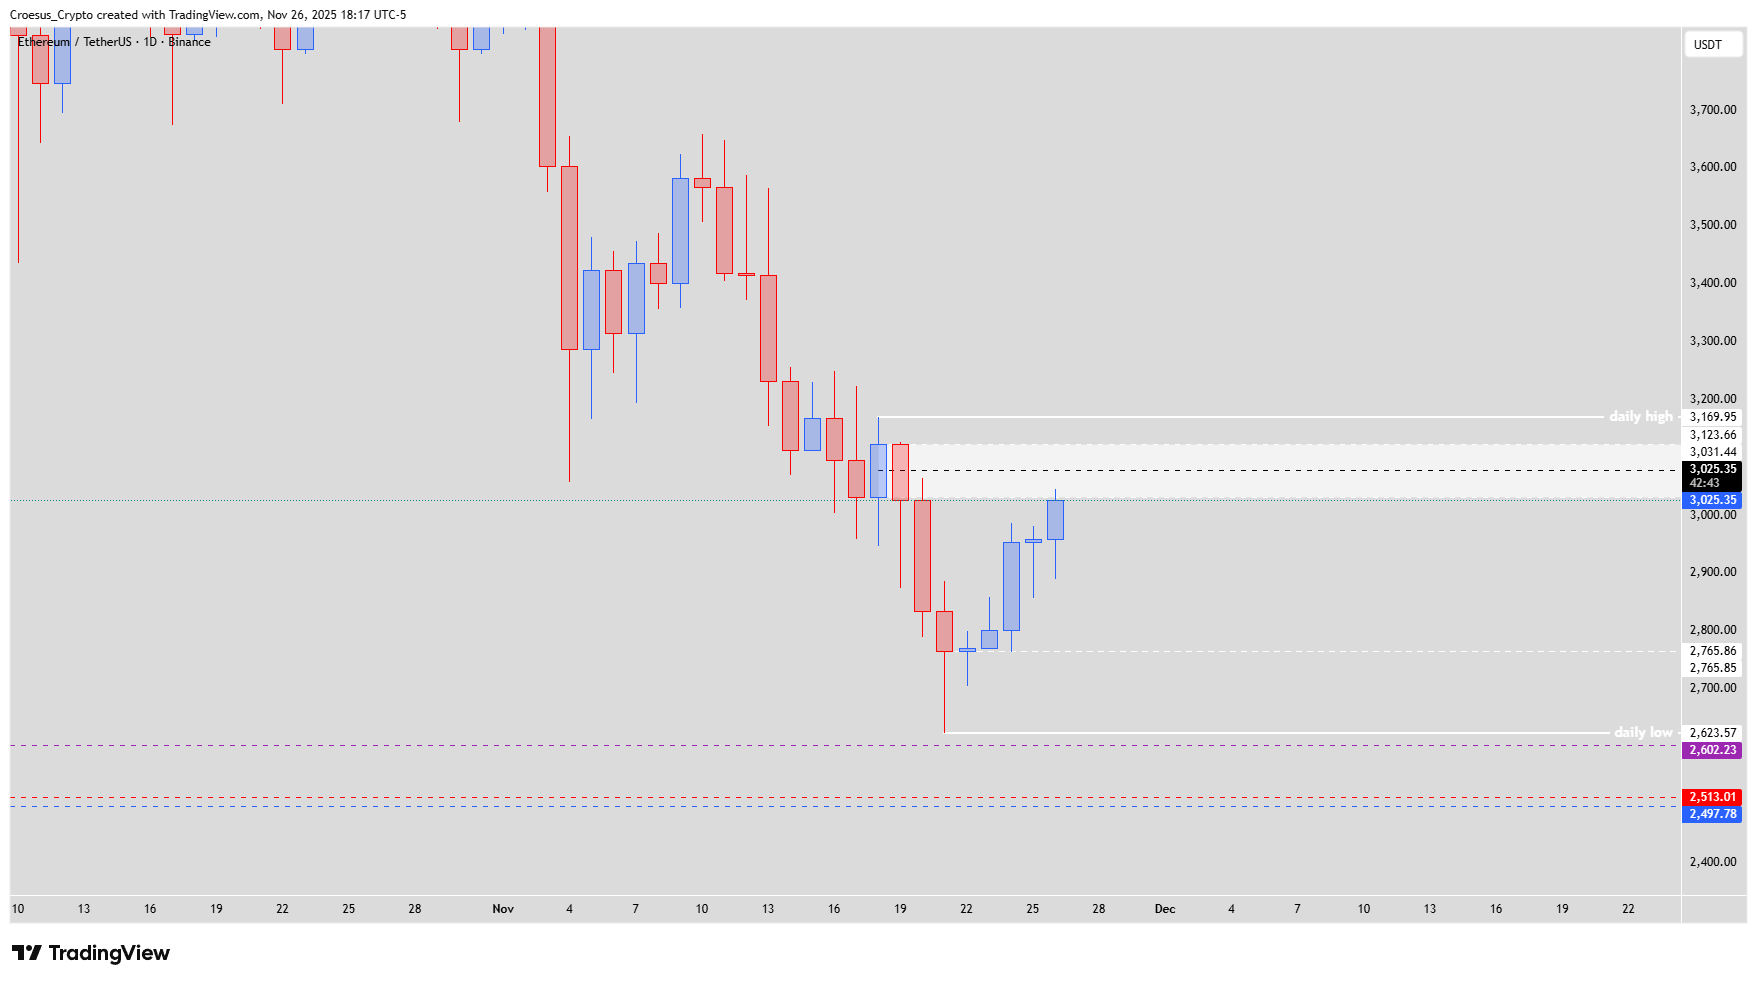
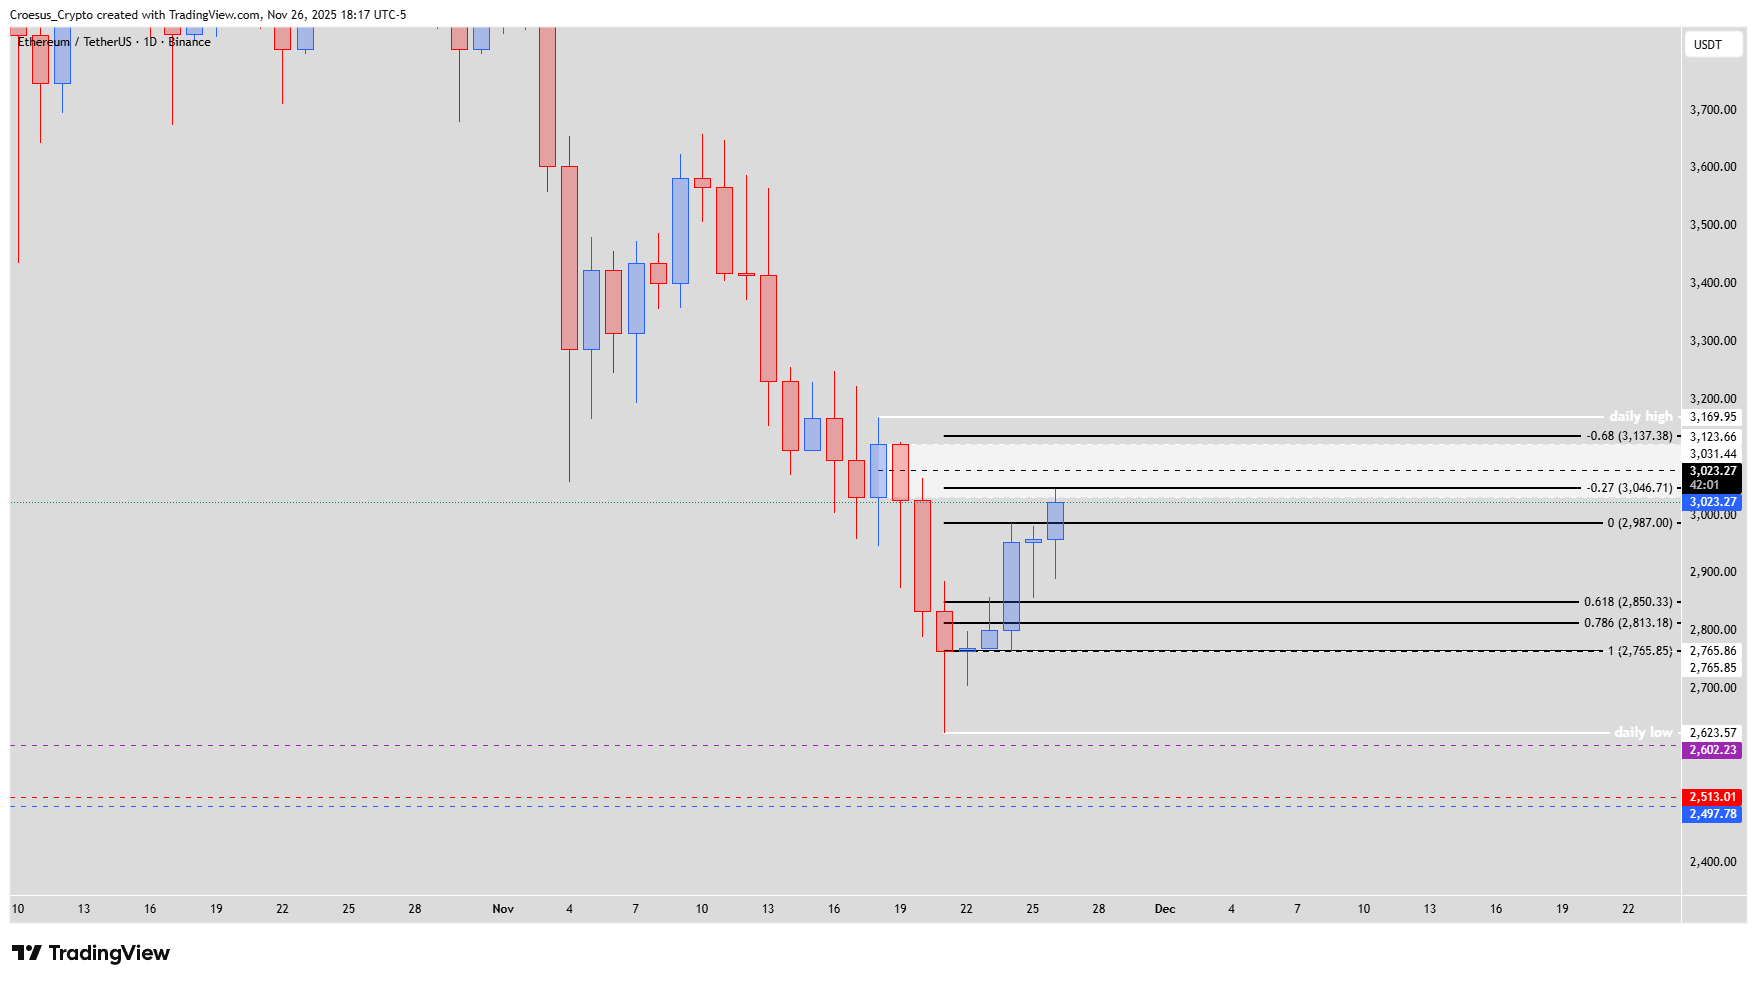
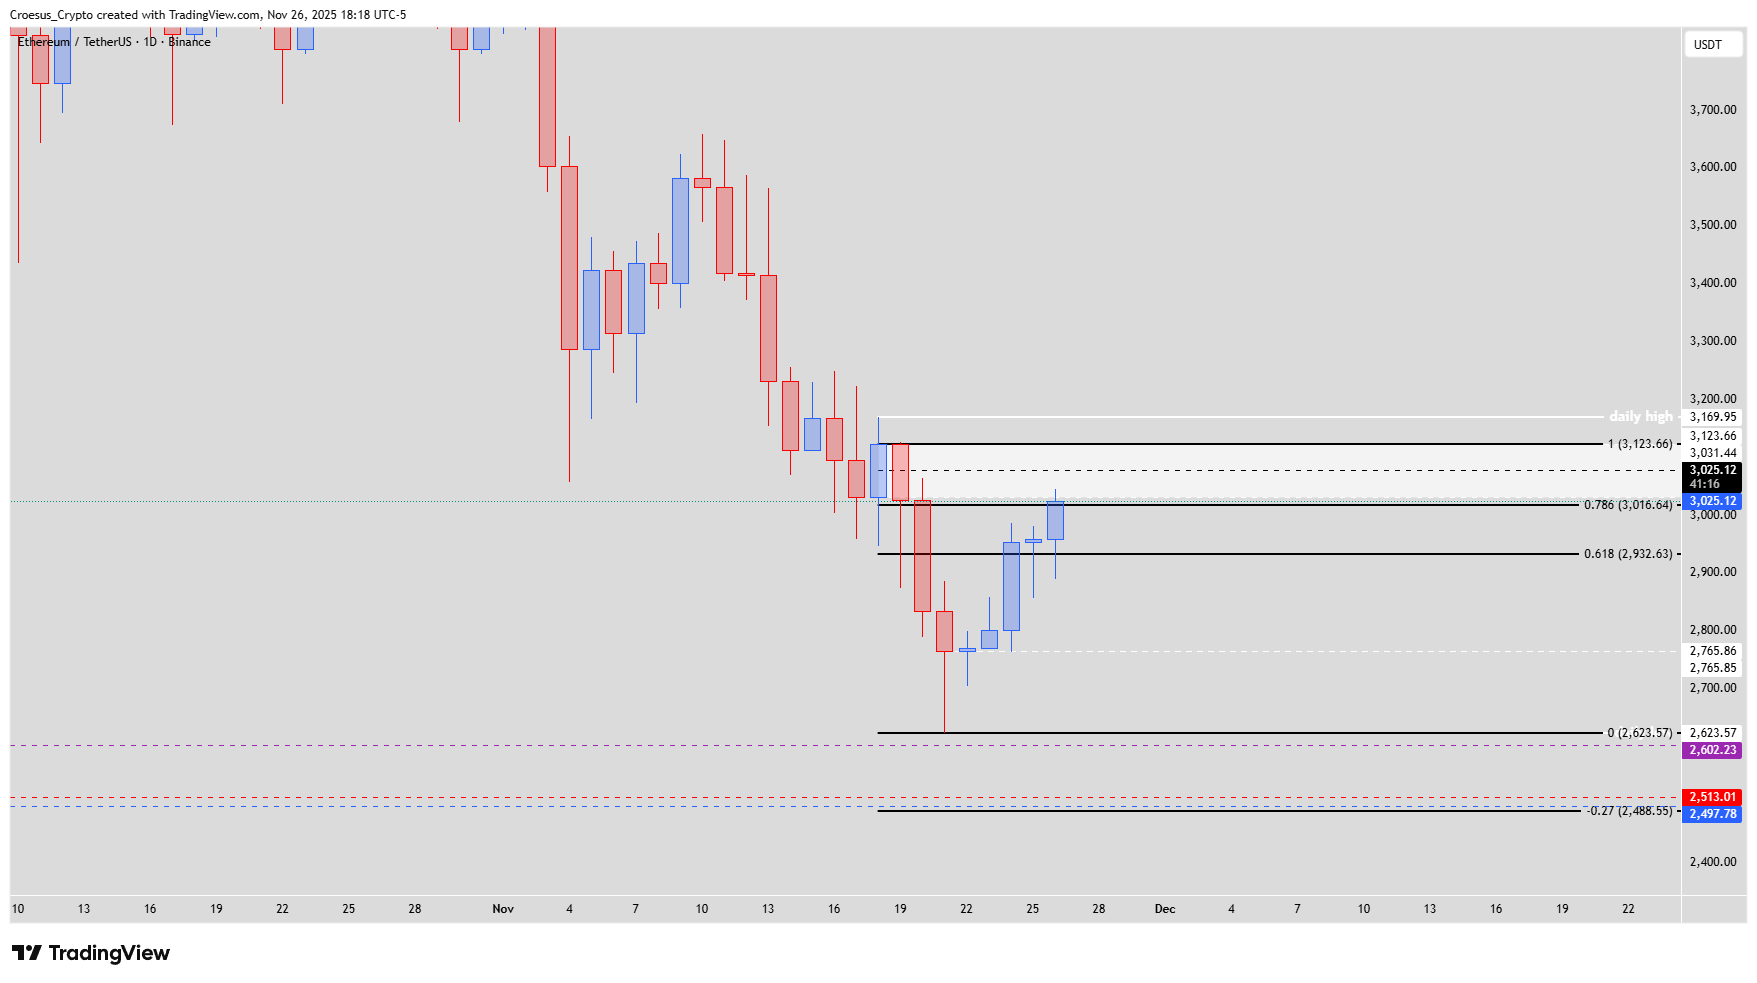
Ethereum daily chart 26 November 2025 showing ABC correction, 0.618 pullback and -0.27 extension near the 3,000 zone.
Trend = bearish ↓
Technical Analysis Key Points
- Where price pulled back, nearly but not touching the 0.618 level, we saw the price go higher again, nearly touching the -0.27 level.
- We shouldn't be suprised that price still corrects towards that 0.618 level before pushing on higher.
- Price touched the low of the daily entry zone, but if price would respect the ABC correction, price could go as high as the -0.68, which resides in the fake out zone above the daily entry zone.
- This bullish reversal might seem to be impulsive, but still needs to be considered as a bullish correction of the last bearish push down
- In order to see a bullish reversal the daily high @ 3,169.95 $ needs to be reclaimed and defended.
- A retest of the zone around 3,000 $ seems more than likely, possibly initiating a further bearish continuation. If we look at the fib retracement of this bearish W, we can see that the fib completion -0.27 not only is confluent with a weekly key level but also a monthly and 3monthly key level.
Market Structure Analysis
This Ethereum daily analysis shows price respecting an ABC corrective structure after a strong bearish push down. The near-touch of the 0.618 Fibonacci retracement, followed by a move toward the -0.27 extension, signals a classic corrective rally rather than a confirmed reversal. The daily entry zone around 3,000 $ has already attracted bids, but the pattern suggests price may probe deeper toward the 0.618 before any sustained push higher. The fake-out zone above the entry zone, where the -0.68 Fibonacci extension aligns, is a prime area for trapped breakout buyers and potential fresh supply. Until ETH reclaims and holds above the 3,169.95 $ daily high, our technical analysis treats this advance as a counter-trend move inside a dominant bearish market structure.
Key Levels and Scenarios
Bullish scenario: a decisive break and daily close above 3,169.95 $, followed by successful retests of this level as support, would be the first sign that the bullish correction is evolving into a real reversal.
Key levels to watch:
3,169.95 $ – daily high; reclaim and defense needed for sustained bullish bias.
Fake-out zone above the daily entry zone – houses the -0.68 Fibonacci extension and potential liquidity grab.
3,000 $ area – lower boundary of the daily entry zone and likely retest region.
0.618 retracement zone – support area that may still be revisited before any larger move.
-0.27 Fibonacci completion – confluent with weekly, monthly and 3-monthly key levels and a potential medium-term downside magnet.
Trading Implications
For now, rallies into the daily entry and fake-out zones remain suspect, with better risk/reward in fading strength near resistance while keeping invalidation tight above 3,169.95 $, whereas conservative traders may wait for a clear break of either major level before committing capital.
This publication is for educational purposes only and does not constitute financial advice or a recommendation to buy or sell any asset.