


ETH Marketcap / Ethereum
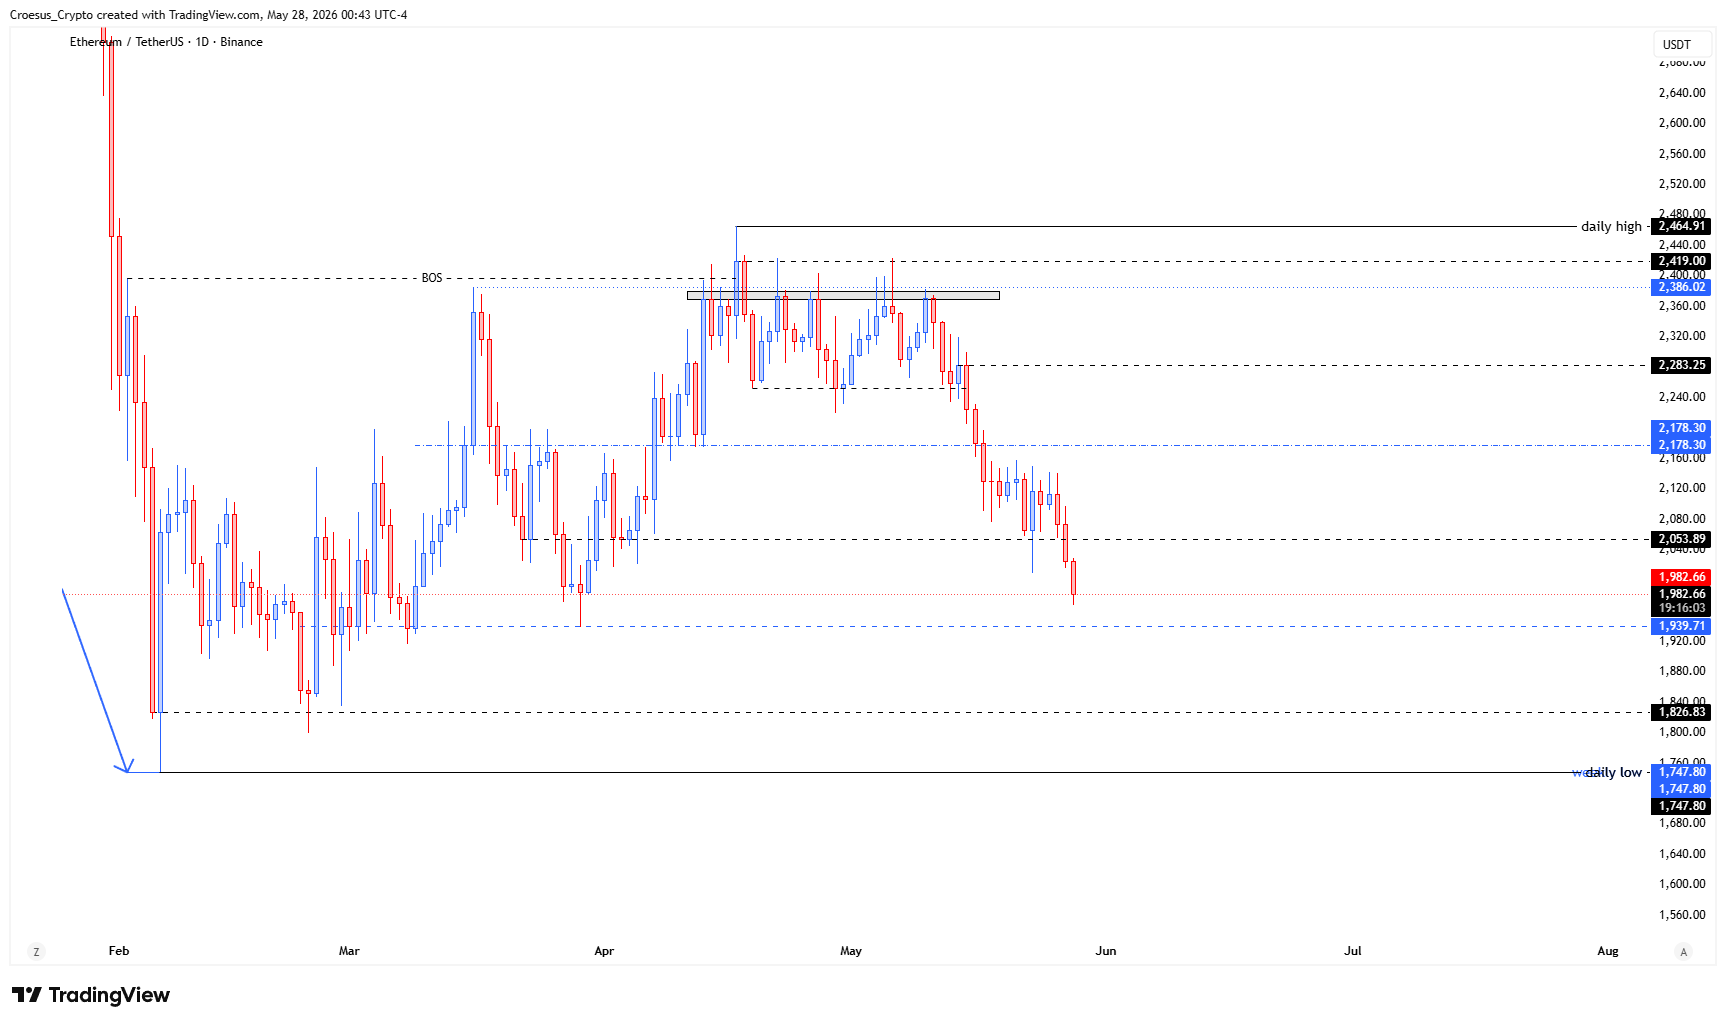
ETH daily analysis 27-05-2026. Ethereum remains structurally heavy on the daily timeframe as price fails to reclaim prior breakdown territory and continues to respect downside Fibonacci objectives in our technical analysis.
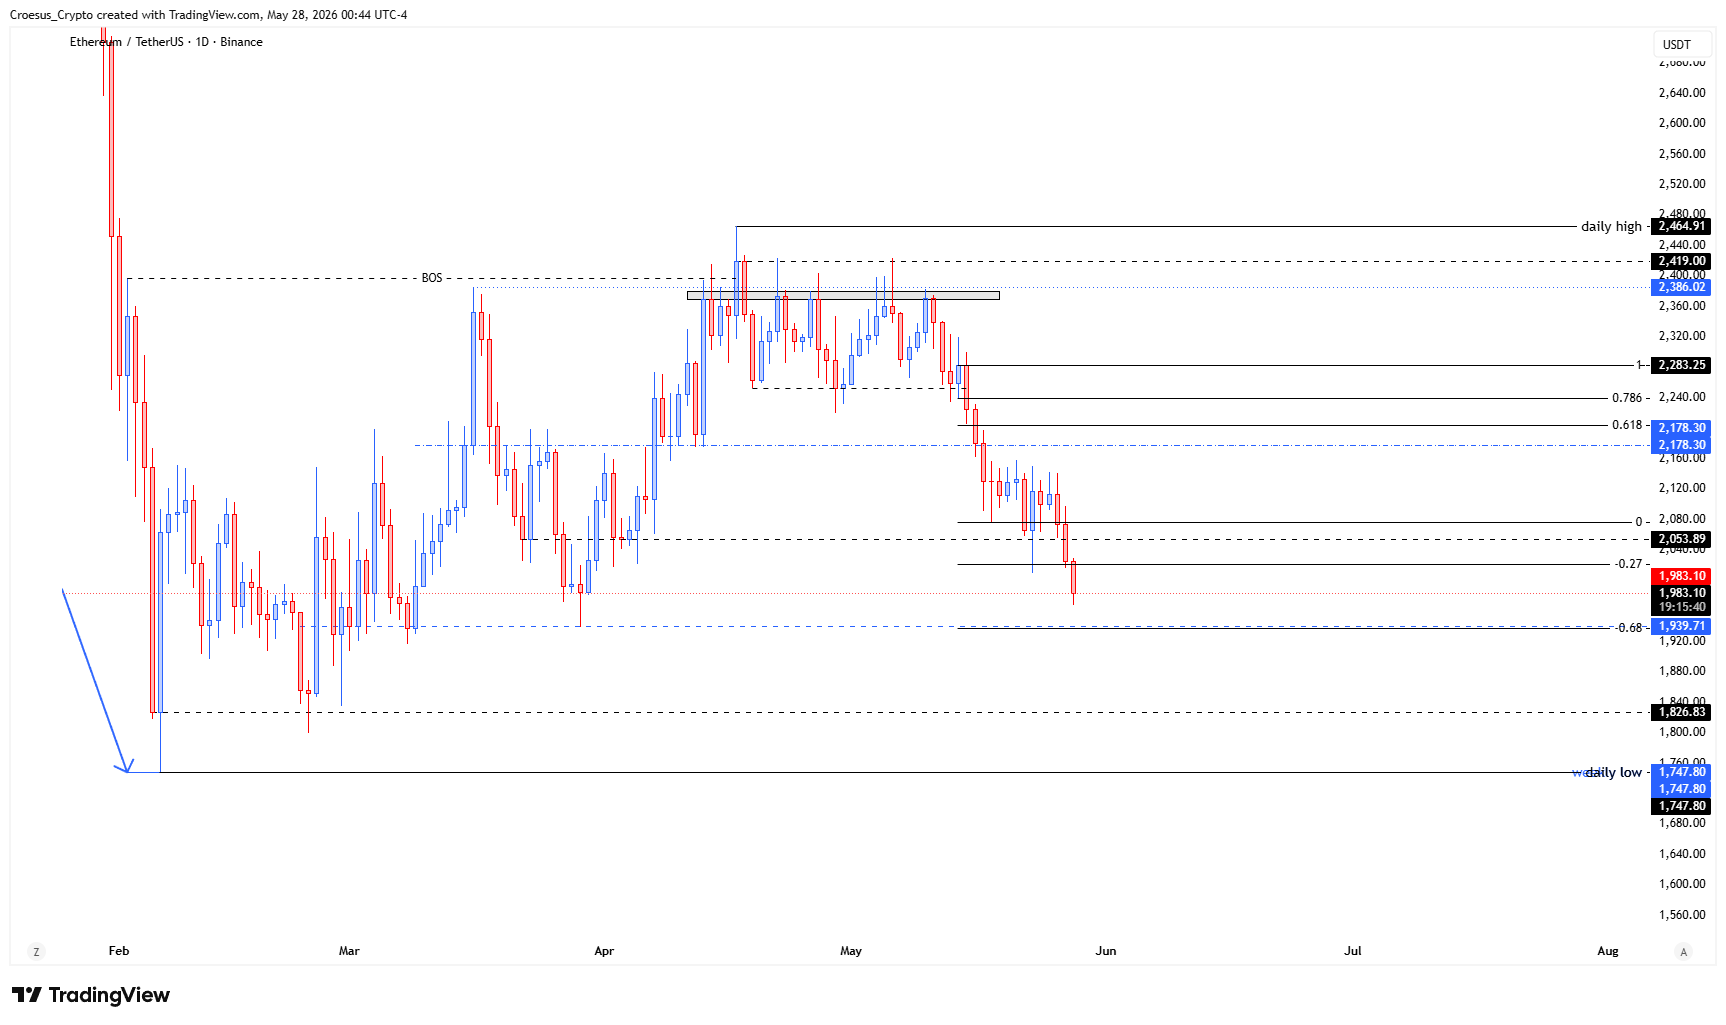
- ETH daily analysis shows that the retest of the last bearish leg down failed, touched the -0.27 and is now continuing its way towards the -0.68.
- Positive point : -0.68 aligns with a weekly key level where we should see some bullish reaction if we want to continue the weekly bullish corrective move of the broader bearish impulse
Market Structure Analysis
The failed retest of the last bearish leg down signals that prior support has flipped into resistance, keeping ETH in a bearish market structure on the daily chart. From a naked trading perspective, this is a clean “retest and reject” sequence: price attempted to retrace into the breakdown zone, but sellers defended that area and forced continuation. The touch at the -0.27 level acts as confirmation that the corrective bounce is being capped, and that the current move is behaving more like an impulsive continuation leg rather than a base-building correction. Our ETH daily analysis therefore stays focused on how price behaves as it approaches the next downside objective at -0.68, especially given the noted higher-timeframe confluence.
Key Levels and Scenarios
Bearish continuation remains the primary scenario while price stays below the failed retest area, with the -0.68 zone acting as the next downside magnet. The constructive alternative is a bullish reaction at -0.68, where a weekly key level could act as support resistance “memory” and potentially fuel a weekly corrective bounce within the broader bearish impulse. In practice, we want to see clear acceptance or rejection at that confluence before expecting follow-through in either direction.
- The failed retest zone of the last bearish leg down as near-term resistance
- The -0.27 level as the most recent downside reaction point
- The -0.68 level as the next downside objective
- The weekly key level aligning with -0.68 as a potential reaction/support area
Trading Implications
Risk is elevated into the -0.68 confluence because it can produce sharp two-sided volatility: aggressive bears typically look for continuation confirmation, while conservative participants often wait for a reaction and structure shift before acting. This ETH daily analysis stays level-driven: the closer price gets to the weekly confluence, the more important it becomes to manage exposure around invalidation points rather than chasing extension.
This analysis is for informational purposes only and does not constitute financial advice.