


ETH Marketcap / Ethereum
ETH daily analysis 28 January 2026. Ethereum price trades back out of a prior fake out zone and the current rejection behavior keeps the focus on nearby support resistance, especially as lower-timeframe structure starts to align with a potential bearish continuation.
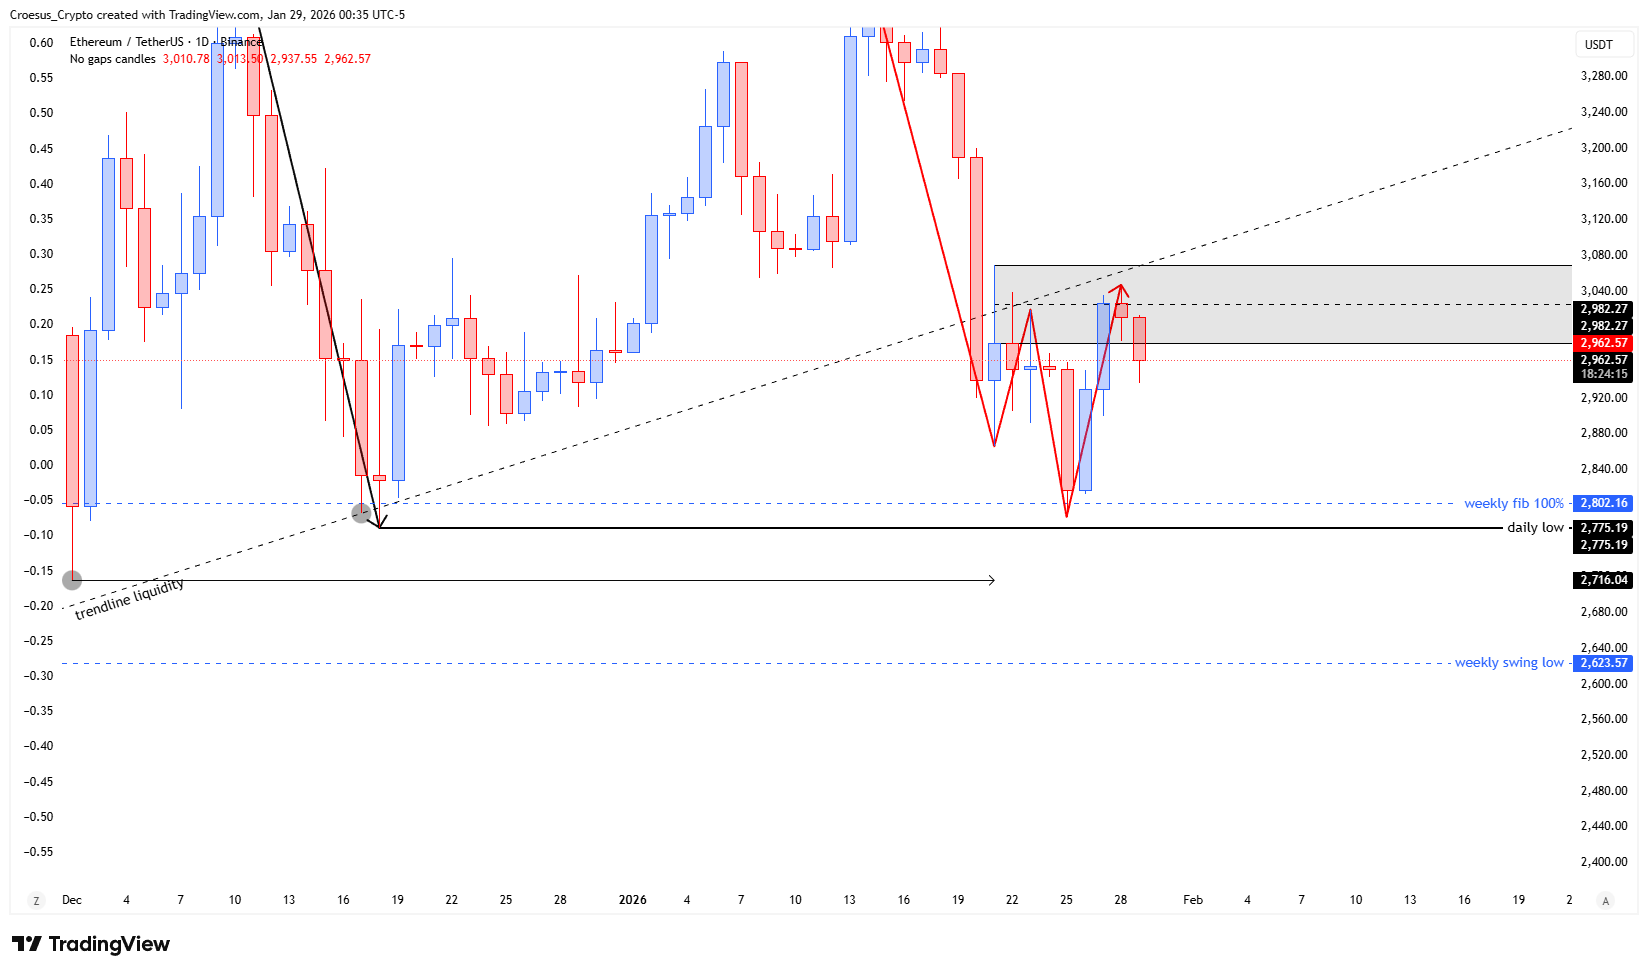
- Price moved into the fake out zone but shows signs of rejection, moving back out of that zone.
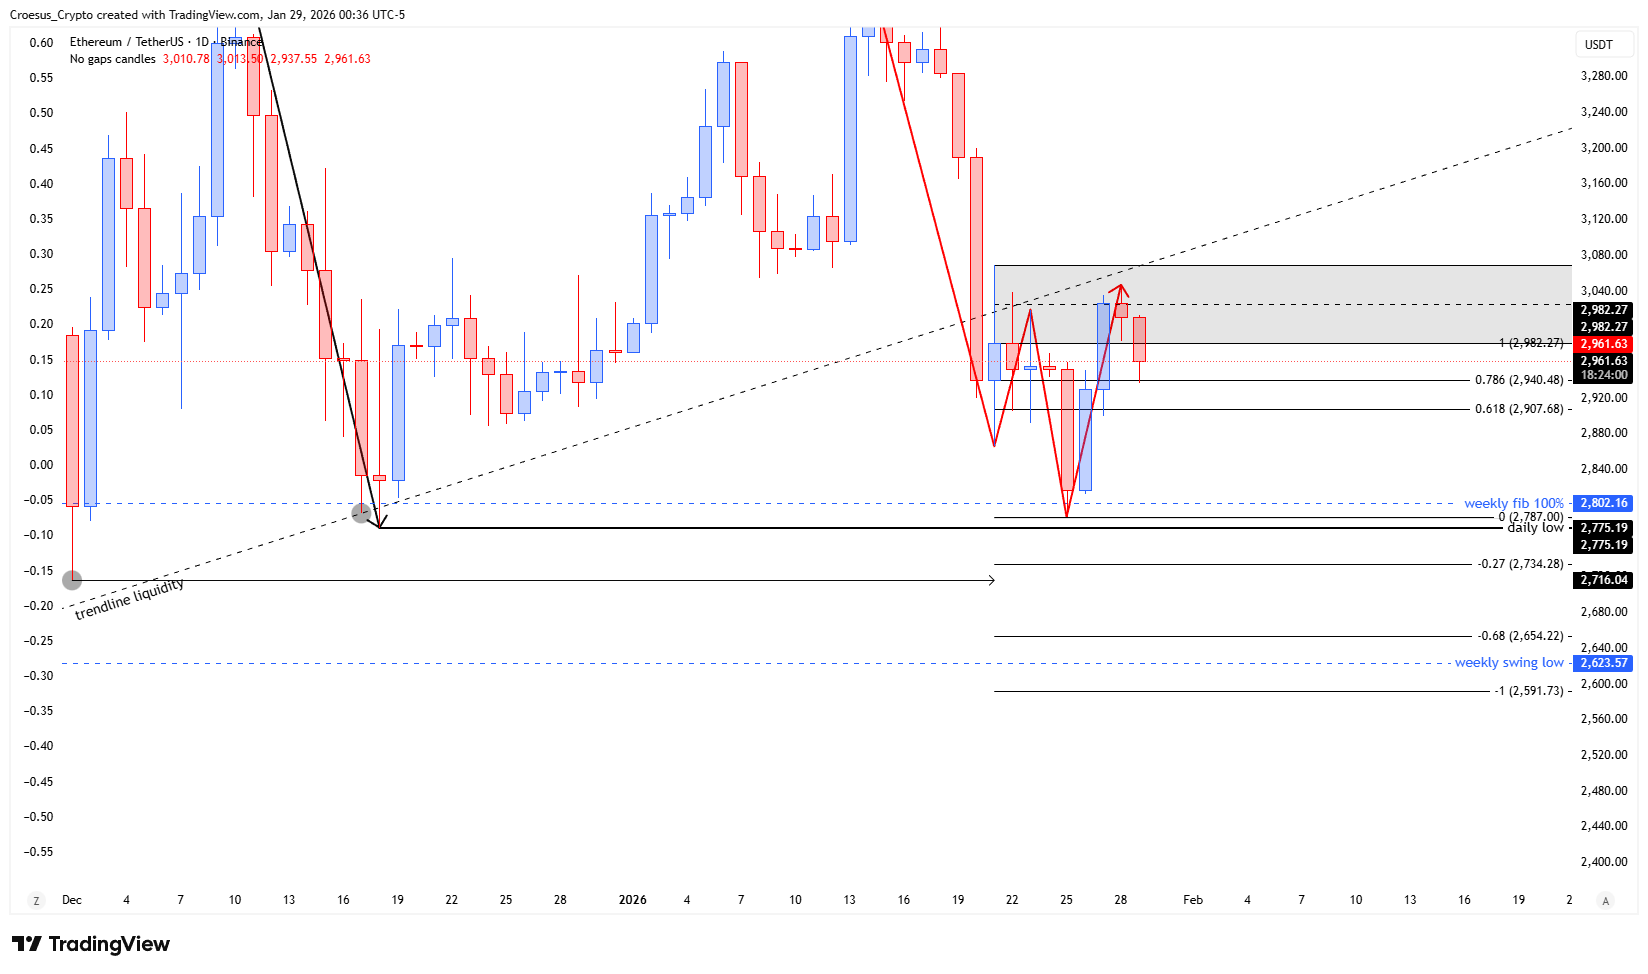
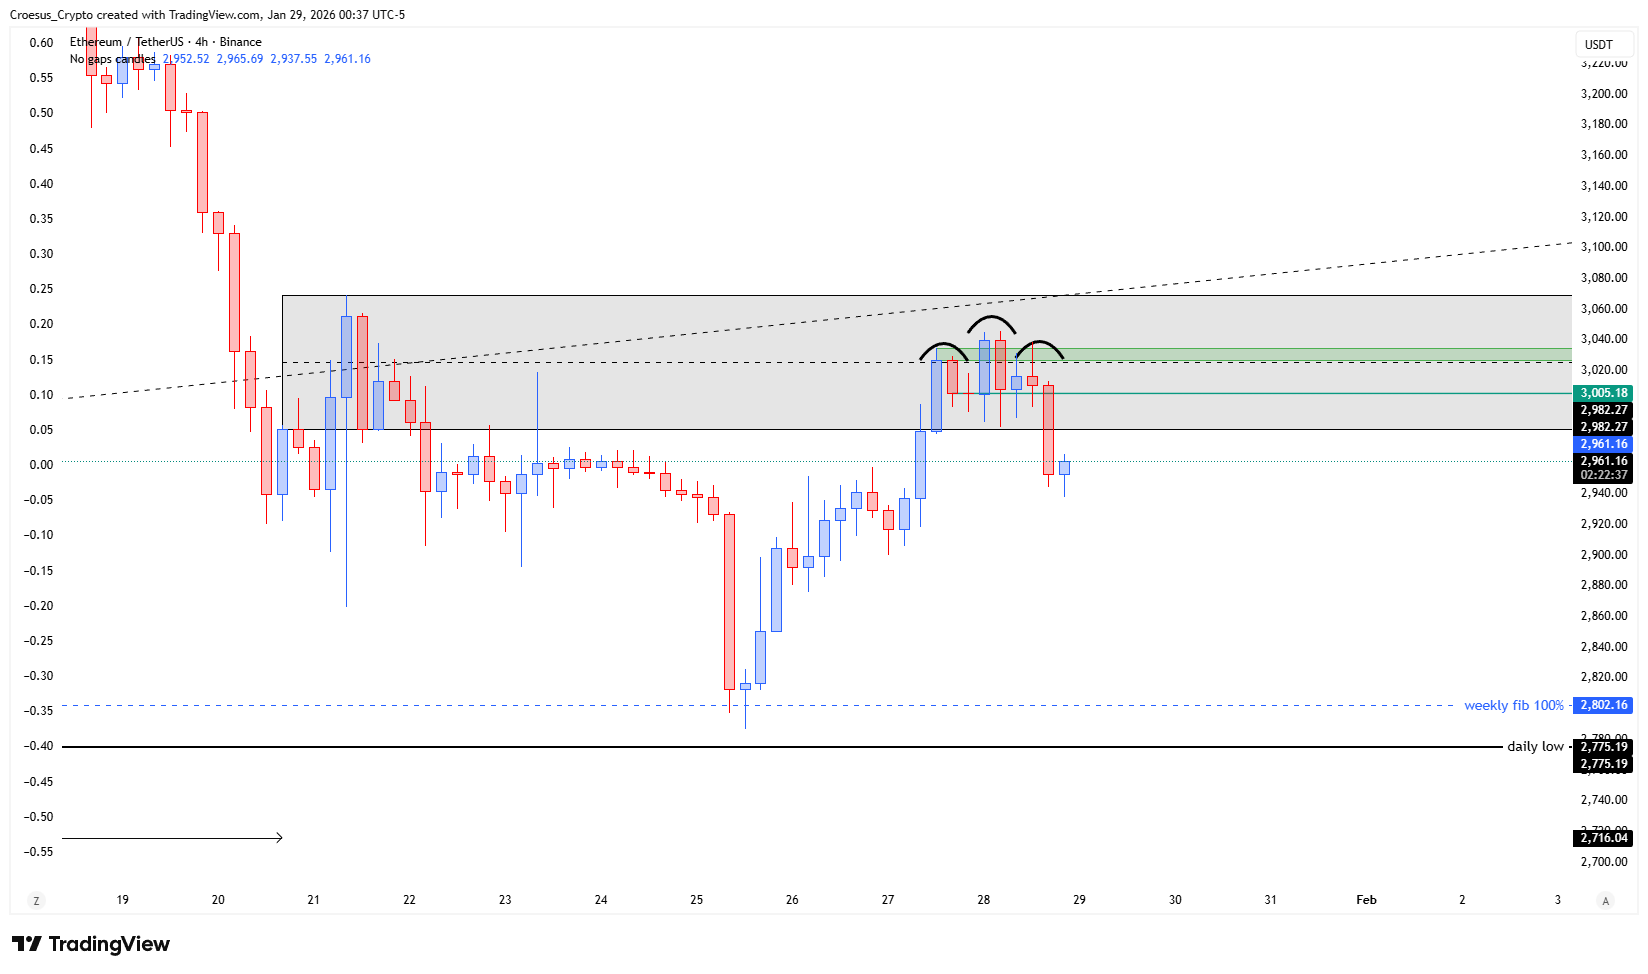
- If we zoom in on the 4H timeframe, we can an entry pattern developing, a head and shoulders pattern. Strictly speaking we have already seen a retest of the neckline and a confirmed retest of the shoulder level, so the pattern is active. But a retest of the neckline is more than likely. Stoploss above the shoulderlevel, take profit on the daily -0.27.
Market Structure Analysis
From a market structure perspective, the “fake out zone” push and immediate rejection reads like a liquidity-driven move where price briefly accepted above a key area and then failed to hold. That failure typically shifts attention back to the prior range and its internal levels, with the reclaimed boundary acting as resistance.
Zooming into the 4H context, the head and shoulders structure adds a clear swing framework: a defined left shoulder, a head, and the right shoulder zone that is already being respected. With the neckline already retested once and the shoulder level confirmed, our ETH daily analysis treats the pattern as active, while still acknowledging that price often revisits the neckline before expansion.
Key Levels and Scenarios
For bearish continuation, acceptance back below the fake out zone and continued respect of the shoulder area keeps downside pressure in play, with the neckline acting as the primary reaction level during any corrective bounce.
A bullish invalidation would require reclaiming and holding back above the shoulder level, which would weaken the head and shoulders thesis. The only explicit target referenced in the draft is the daily “-0.27”, which is treated as a mapped Fibonacci objective rather than a guarantee.
- Fake out zone boundary as reclaimed resistance vs acceptance trigger
- 4H neckline as the main retest/pivot level for short-term structure
- Shoulder level as the key invalidation reference for the head and shoulders
- Daily -0.27 as the referenced Fibonacci target area
Trading Implications
This ETH daily analysis is structurally defined: aggressive positioning typically centers around neckline/shoulder reactions, while conservative approaches usually wait for clearer acceptance (break and hold) beyond the fake out zone boundary. The key risk is choppy price action between the neckline and shoulder level, where liquidity grabs can invalidate early bias before the next impulsive move.
This analysis is for informational purposes only and does not constitute financial advice.