


In this ETH daily analysis for late November 2025, we see Ethereum pushing back into the daily entry zone but still failing to clear key Fibonacci resistance. Our technical analysis treats the current move as a potential bullish correction inside a broader bearish structure.
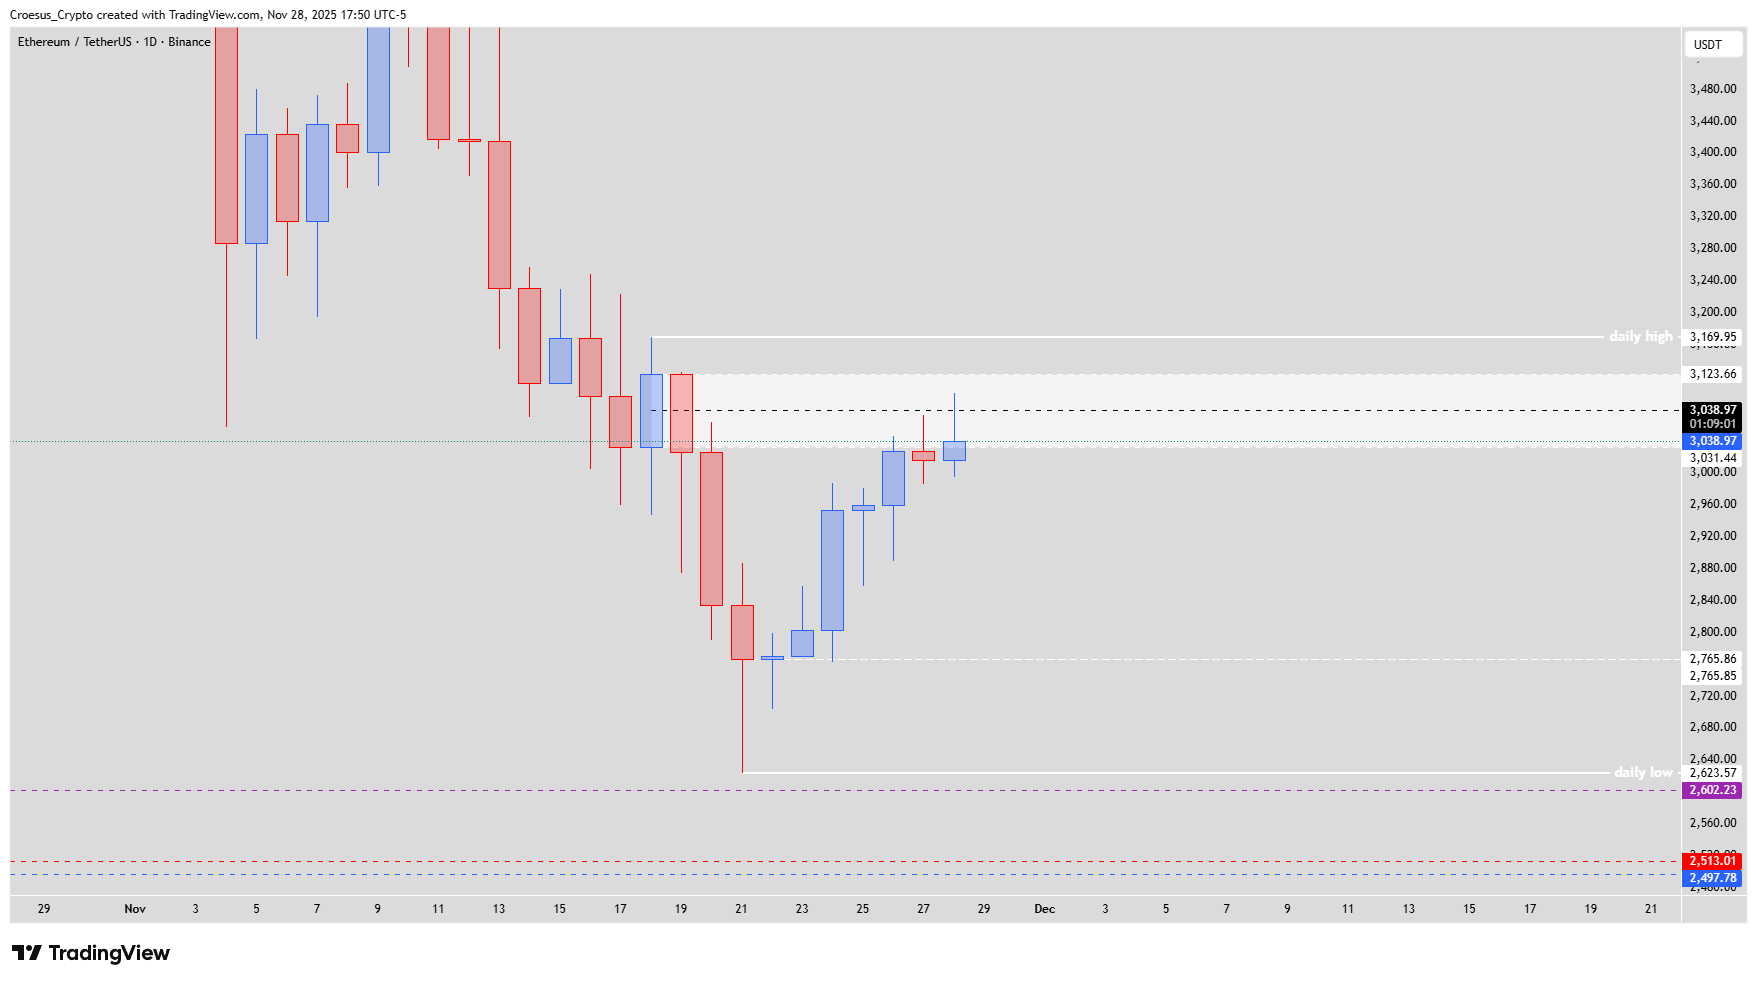
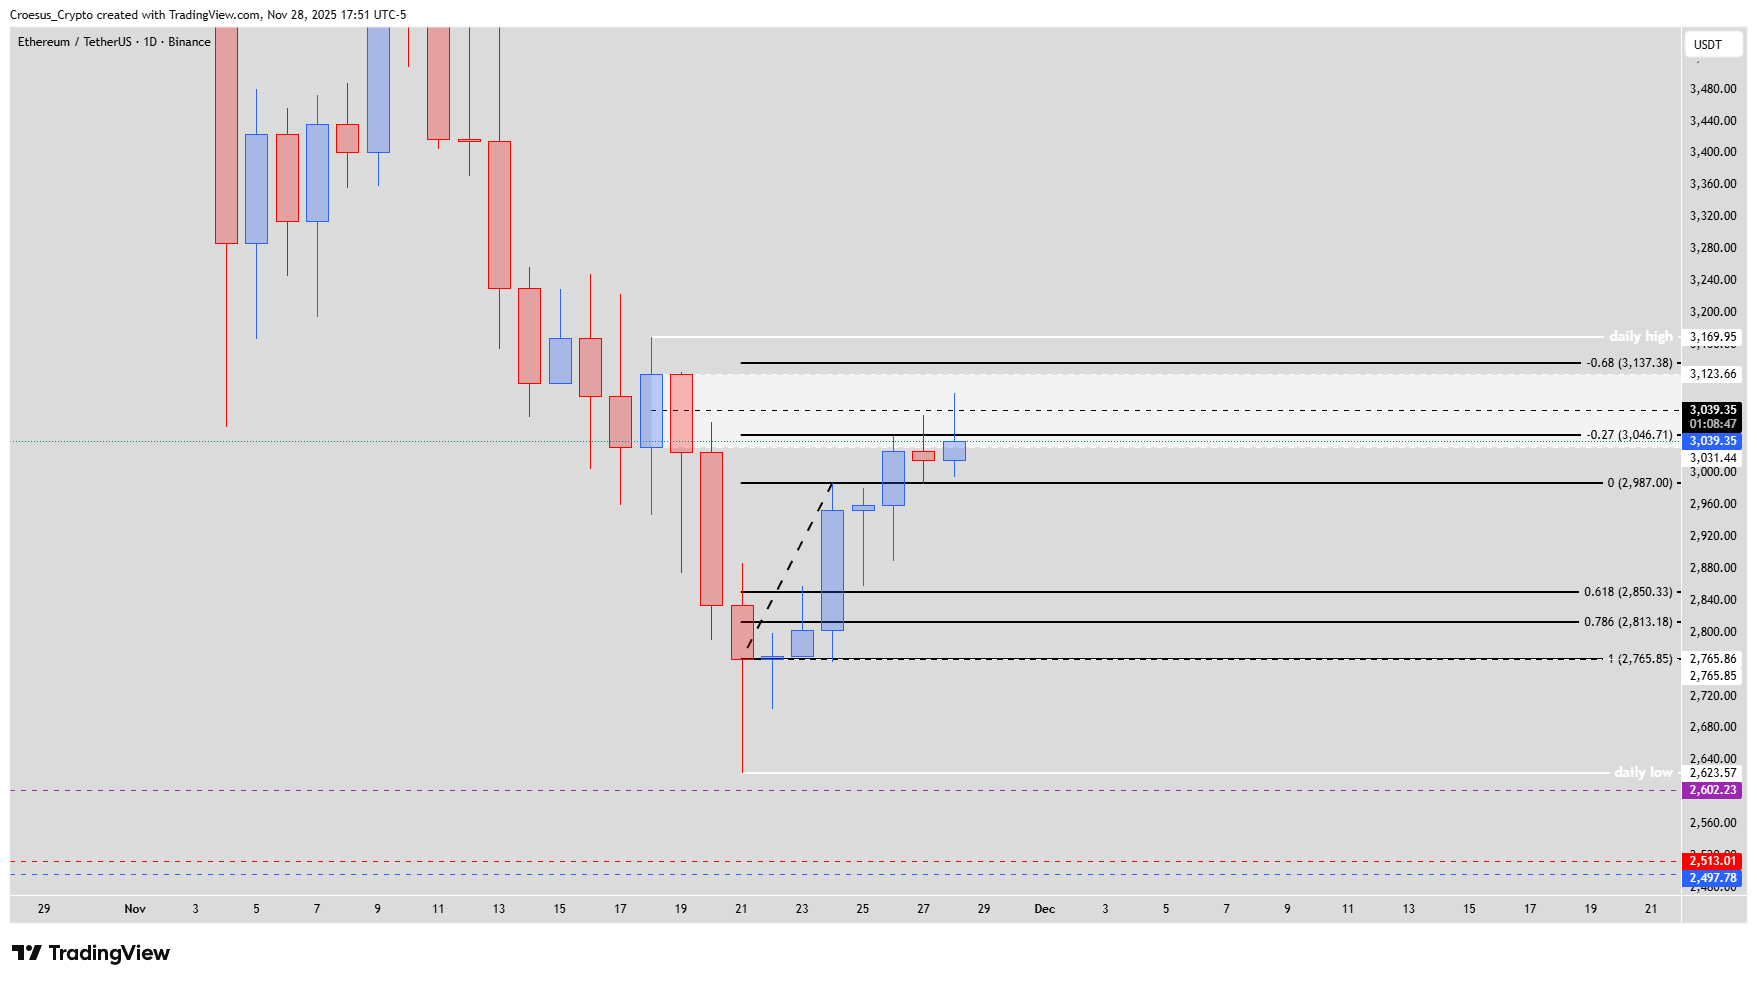
ETH daily chart November 28 2025 showing corrective bounce into resistance below daily high at 3,169.95 $.
Trend = bearish ↓
Technical Analysis Key Points
- Yesterday price just touched the daily entry zone again and had a kind of rejection, but today showed a new bullish candle
- But if we look at the reaction to the fib levels, we can see that price remains stuck below -0.27.
- The fib level -0.68 remains to be retested.
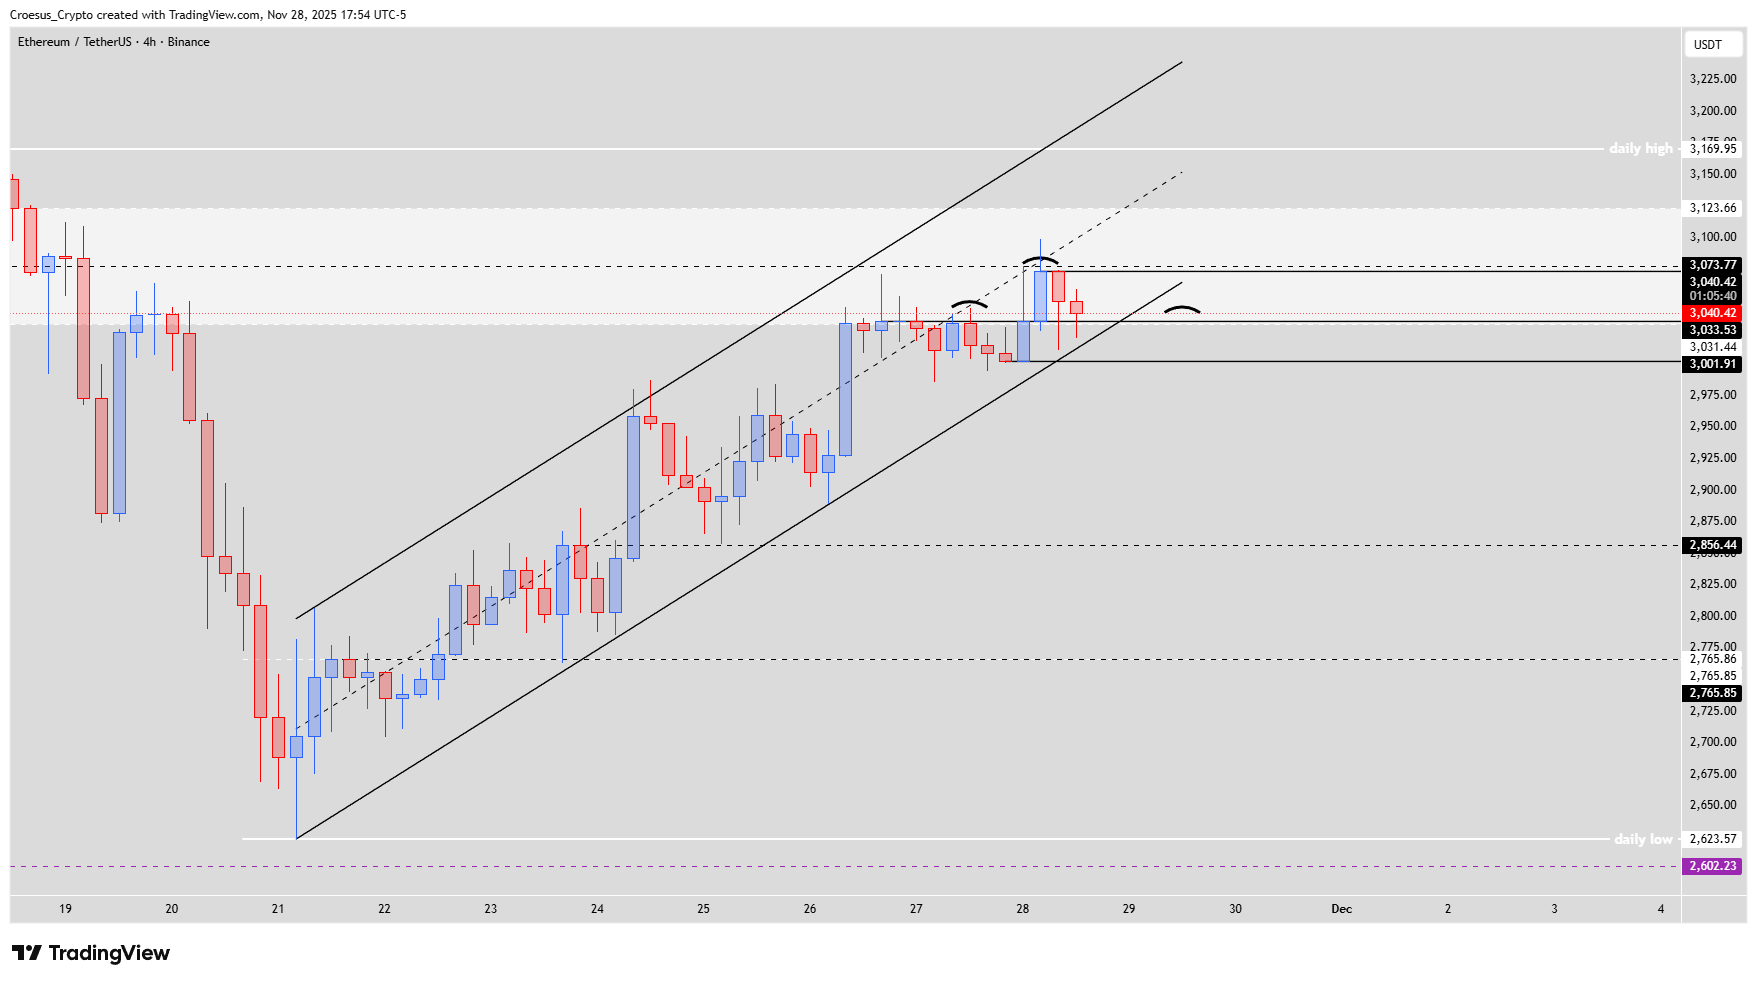
- Nevertheless, price touched the daily entry zone / first structure, so we can start looking for reversal patterns on the lower 4H time frame.
- Here we can see a new potential head and shoulders pattern, it could still be a bullish M as we don't have a break of structure.
- This bullish reversal might seem to be impulsive, but still needs to be considered as a bullish correction of the last bearish push down
- In order to see a bullish reversal the daily high @ 3,169.95 $ needs to be reclaimed and defended.
Market Structure Analysis
Structurally, ETH is grinding higher inside a rising channel, but this ETH daily analysis shows price stalling right under the -0.27 Fibonacci resistance while the -0.68 Fibonacci level remains untested. The touch of the daily entry zone / first structure signals that the corrective leg has reached a key support resistance pivot, where we start hunting for reversal patterns. On the 4H chart, the developing head and shoulders — which could still morph into a bullish M without a clear break of structure — highlights indecision at the top of the channel. Until bulls reclaim and defend the daily high at 3,169.95 $, we classify this bounce as a corrective move against the last bearish push down rather than a confirmed trend reversal.
Key Levels and Scenarios
Bullish scenario: ETH must break above and hold the daily high at 3,169.95 $ to confirm a bullish reversal and negate the current corrective outlook.
Key Levels
Daily high 3,169.95 $ – Key resistance that must be reclaimed and defended for sustained upside.
Daily entry zone / first structure – Current reaction area where we monitor for 4H reversal patterns.
-0.27 Fibonacci level – Overhead resistance currently capping price and defining short-term range.
-0.68 Fibonacci level – Untested upside target if bulls can extend the correction before any reversal.
Trading Implications
For traders, this ETH daily analysis suggests patience: watch the daily entry zone and 4H structure for confirmation of either a head and shoulders breakdown or a bullish M extension toward -0.68, keeping tight stops and conservative position sizing around these inflection zones.
This publication is for educational purposes only and does not constitute financial advice or a recommendation to buy or sell any asset.