


ETH Marketcap / Ethereum
ETH daily analysis 28/05/2026. Ethereum is trading in a bearish context as price pulls back toward a higher-timeframe support area, putting the market at a decision point where buyers must show response to avoid further continuation to the downside.
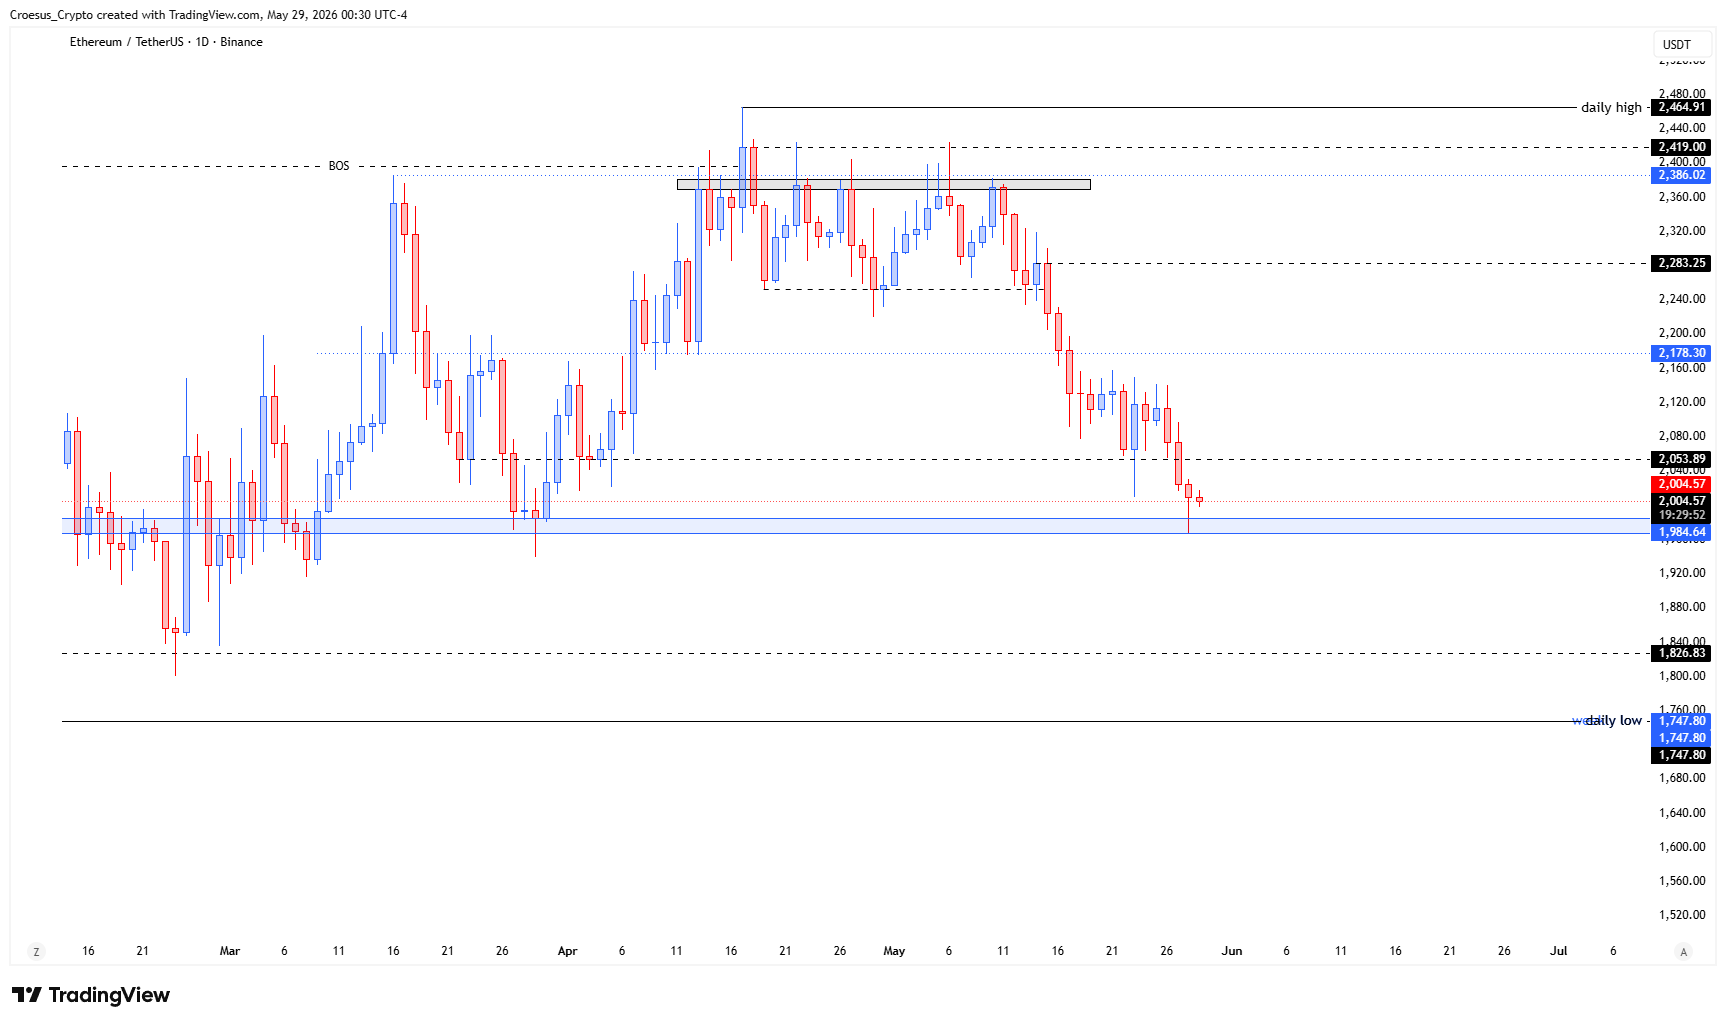
- ETH daily analysis shows us the price falls back towards a weekly key level (fib 100%).
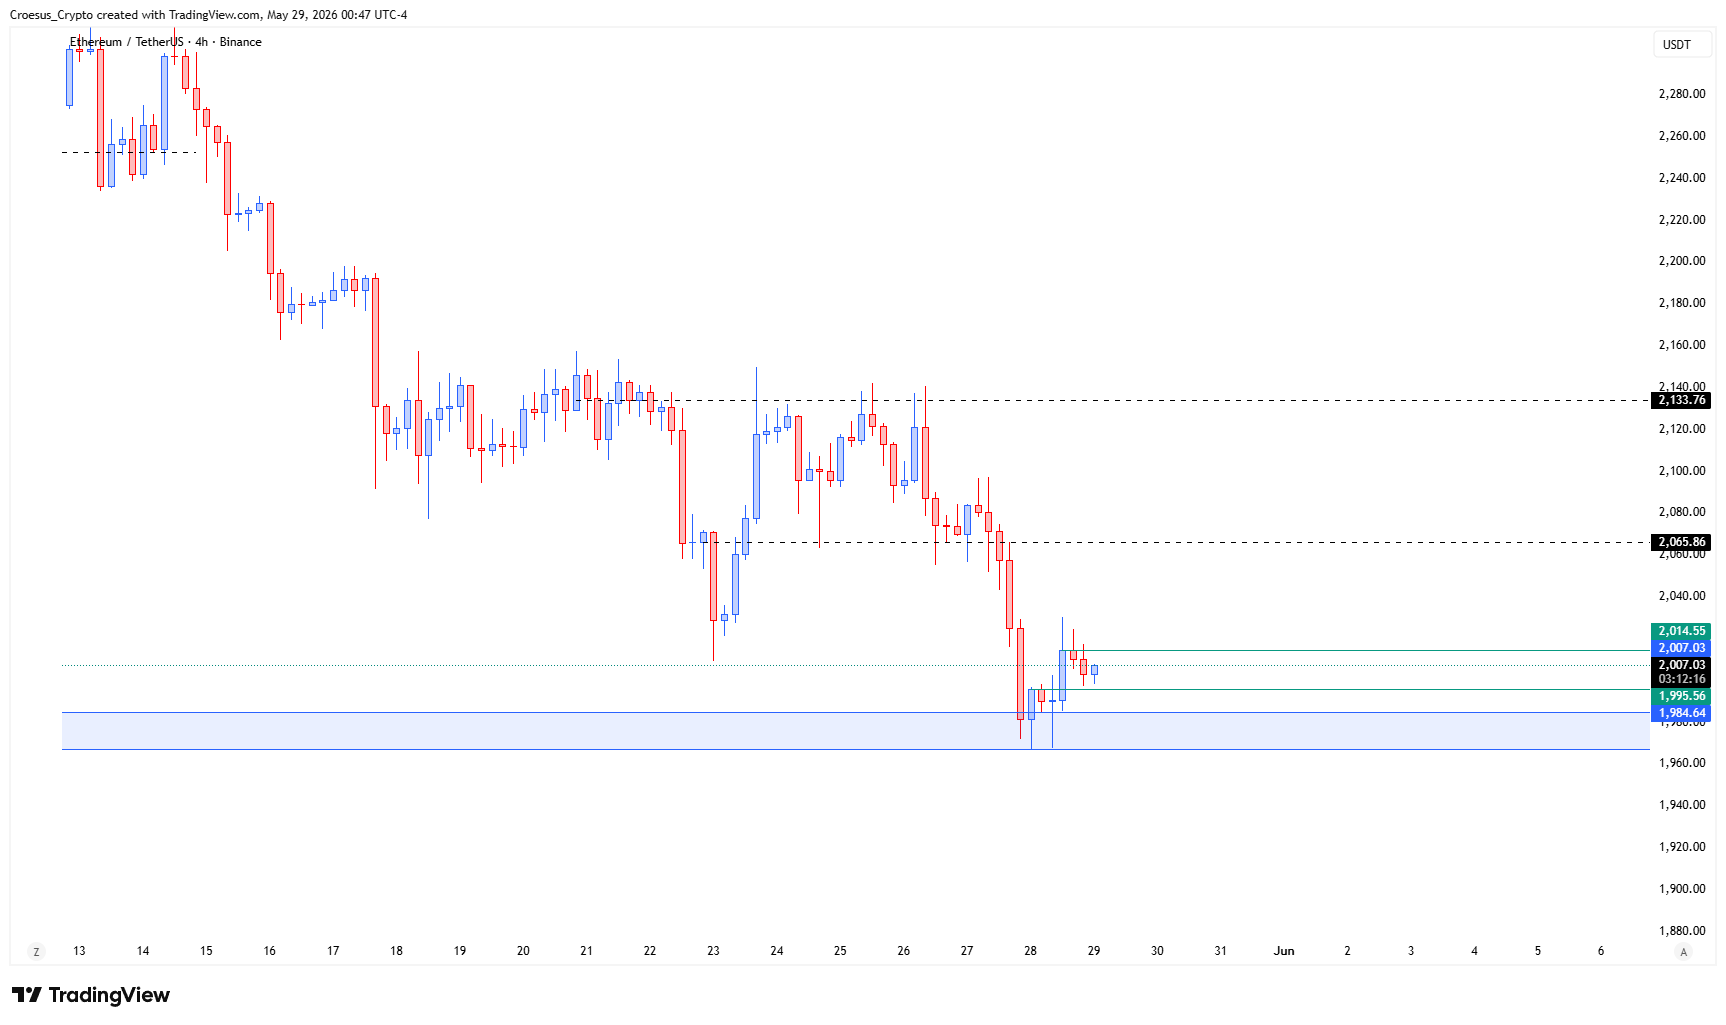
- If we look at the lower time frame 4H chart, we need to see some kind of a reversal. We can clearly notice a bullish M.
Market Structure Analysis
From a market structure perspective, our ETH daily analysis is centered on a bearish sequence that is currently pressing back into a weekly key level, defined here by the Fibonacci 100% area. In naked trading terms, this is the type of zone where we want to see whether the move into support is simply an impulsive continuation, or whether it starts transitioning into a corrective structure with acceptance and a reclaim. The lower timeframe context matters: the 4H chart is highlighted as the confirmation layer, where a visible “bullish M” formation is the early sign that selling pressure may be exhausting and liquidity below/around the level may be getting absorbed. Until that reversal is confirmed, the path of least resistance remains bearish and any bounce is treated as corrective.
Key Levels and Scenarios
Bearish continuation remains the base case as long as ETH fails to produce a clear reversal response at the weekly Fib 100% level. A constructive counter-scenario requires the 4H reversal to trigger and then translate into a daily reclaim of nearby resistance, shifting the immediate structure from continuation into a corrective bounce.
- Weekly key level (fib 100%): primary decision zone for support resistance
- 4H “bullish M” trigger/confirmation area: needs a clean reversal follow-through
- Near-term daily resistance above current price: must be reclaimed to reduce bearish pressure
- Acceptance below the weekly key level: increases odds of continuation lower
Trading Implications
In a bearish trend, risk is typically highest when attempting to anticipate reversals directly into support; conservative positioning waits for the 4H reversal to confirm and then evaluates whether the daily structure can reclaim resistance. If the level fails, downside continuation scenarios generally offer cleaner structure than counter-trend attempts.
This analysis is for informational purposes only and does not constitute financial advice.