


Our Ethereum daily analysis for late December 2025 focuses on price compressing above a rising trendline while repeatedly defending the 2,9xx USDT demand zone. The broader structure remains corrective, but the local pattern hints at a potential bullish rotation back into the upper part of the range.
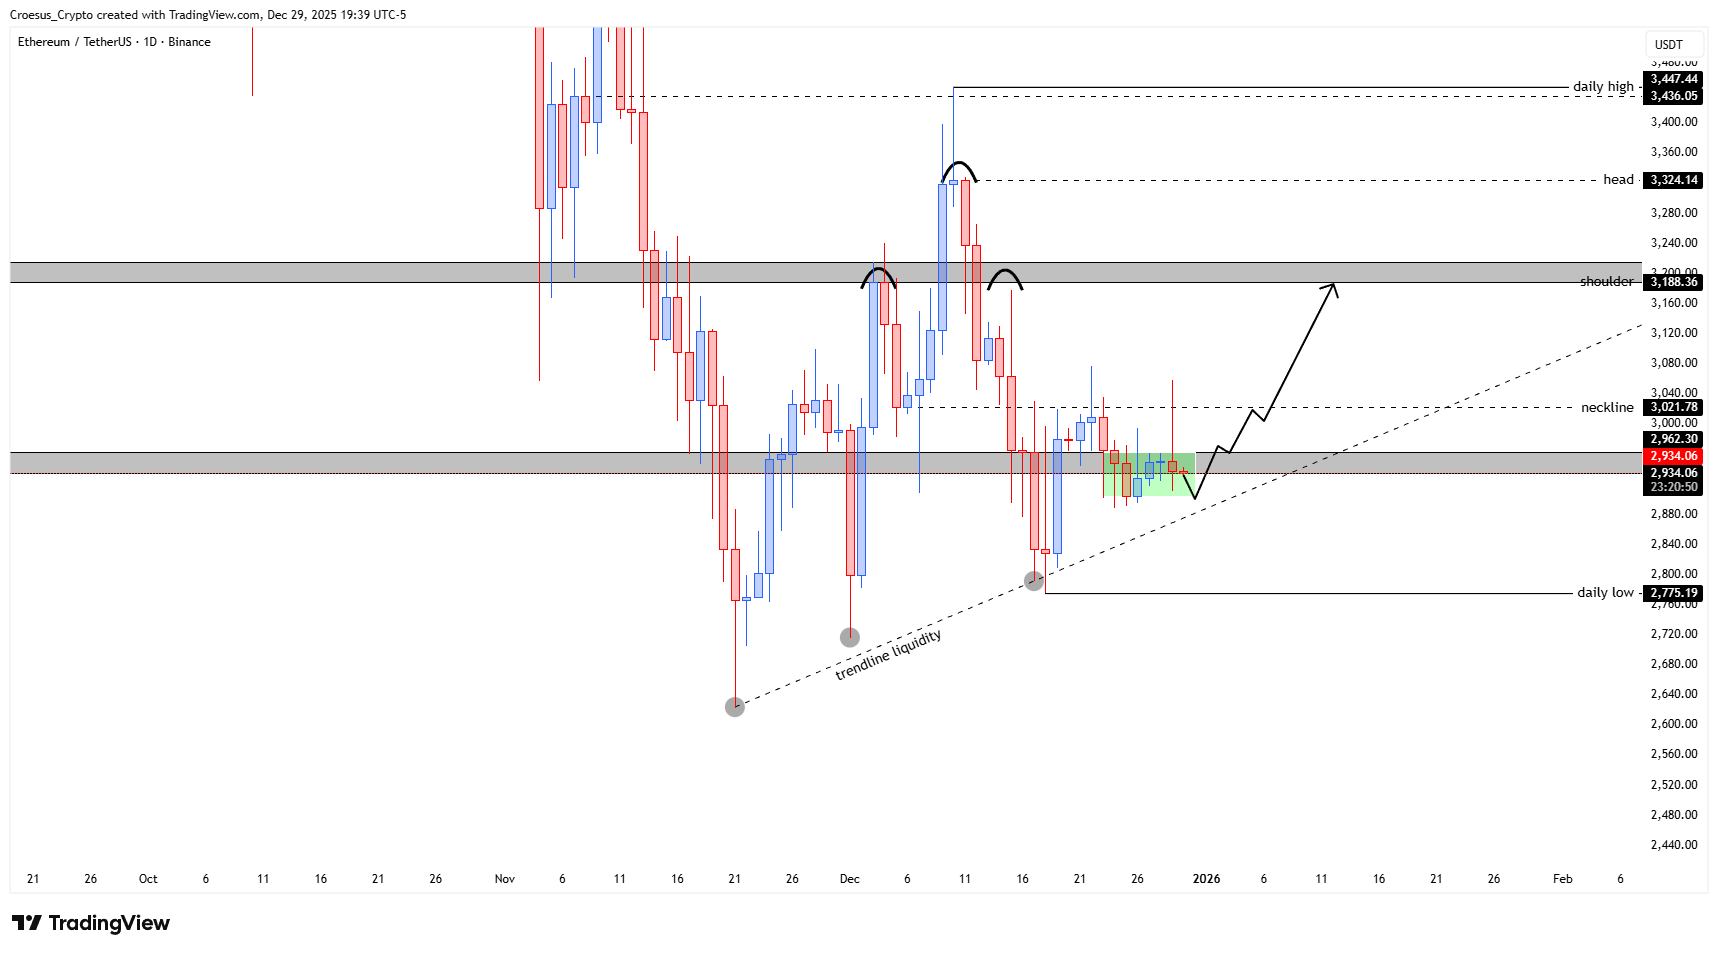
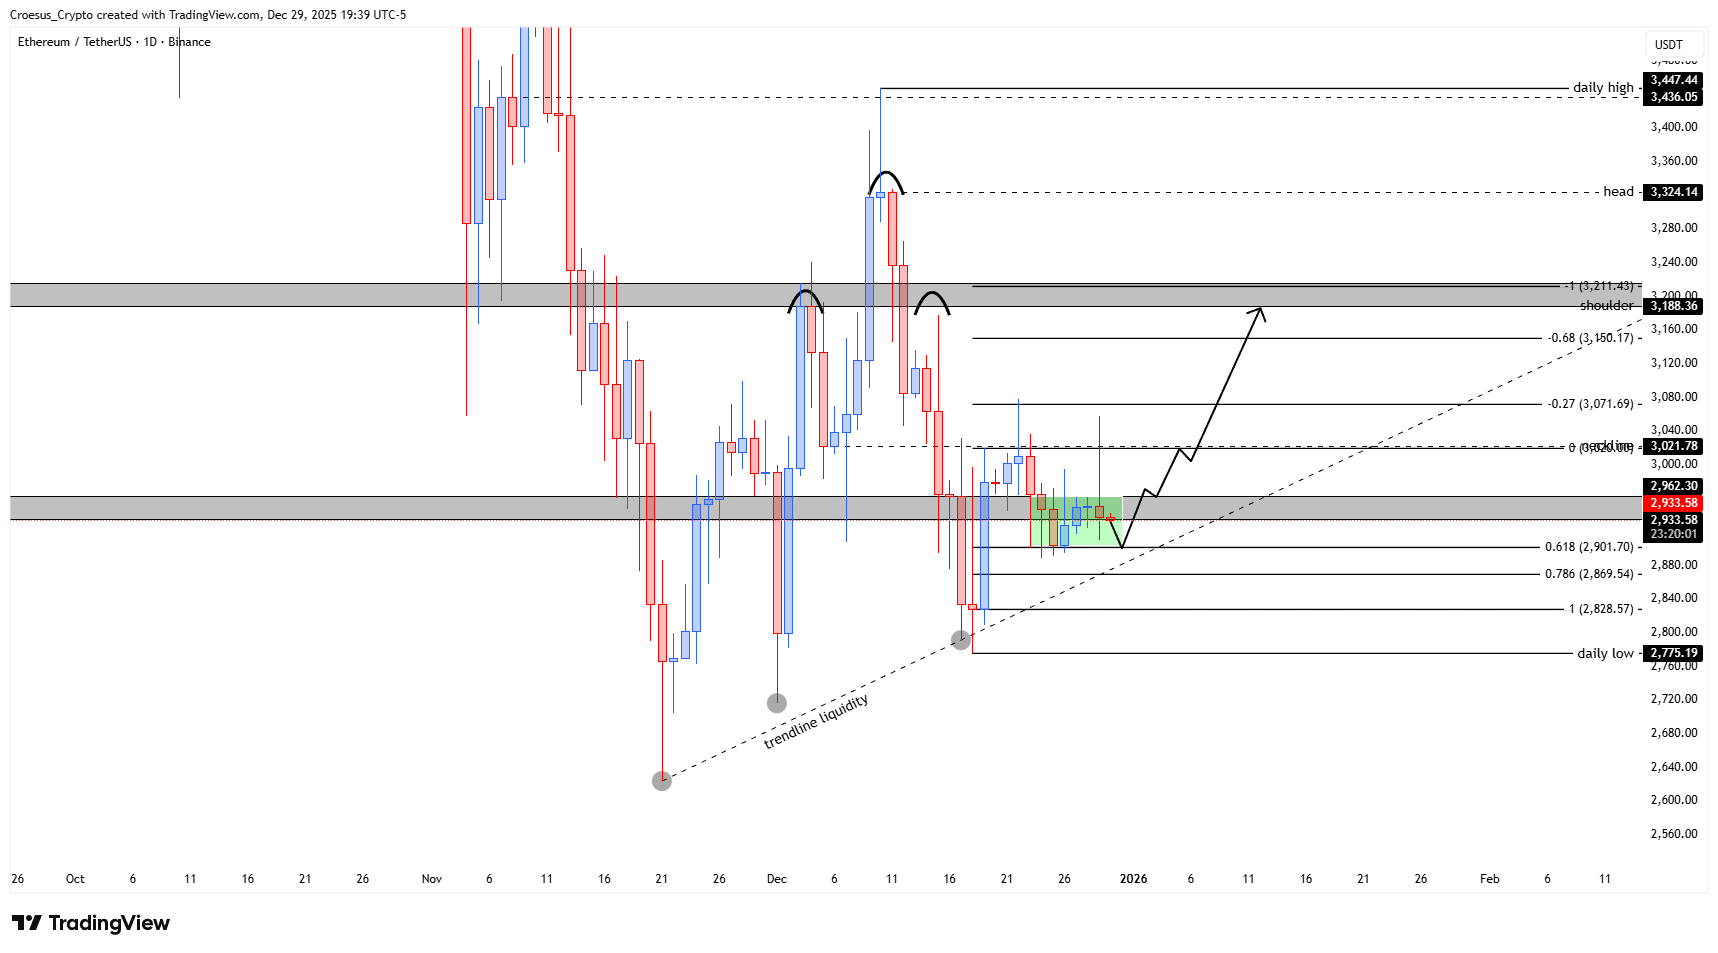
Ethereum daily analysis zoom on 2.9K demand area, neckline around 3.02K and upside arrow into 3.18K shoulder resistance.
Technical Analysis Key Points
- Rising trendline from successive higher lows, tagged multiple times (“trendline liquidity”)
- Current consolidation inside a 2,93x–2,96x USDT support block with repeated demand wicks
- Fibonacci cluster below price: 0.618 at ~2,902, 0.786 near 2,870 and 1.0 at ~2,829 USDT
- Overhead resistance levels: neckline around 3,021 USDT and “shoulder” zone near 3,188–3,210 USDT
Market Structure Analysis
From a technical analysis perspective, ETH sold off into the 2,775 USDT daily low and then started printing higher lows along a rising trendline. This creates a classic dynamic support where liquidity is repeatedly swept but buyers step back in. The current range is framed between the 2,775 daily low and the prior “head” high near 3,324 USDT, with our Ethereum daily analysis treating the 2.9K area as key mid-range demand.
Support is clear: the grey block around 2,93x–2,96x aligns with the trendline and Fibonacci retracement cluster, making it a decisive area for bulls. Above, the 3,021 USDT neckline marks the first structural pivot; reclaiming and holding this level would open the way toward the 3,188–3,210 USDT shoulder zone, and, if momentum persists, possibly back into the 3,324–3,447 USDT upper range.
Key Levels and Scenarios
Bullish scenario (most likely next move):
If ETH continues to respect the 2,90x–2,96x demand area and the rising trendline, we expect a local higher low followed by a push toward the 3,021 USDT neckline. A daily close above the neckline would likely extend into 3,100–3,150 USDT first, then the 3,188–3,210 USDT shoulder.
Levels to watch
2,775 USDT – Daily low and major invalidation of bullish structure
2,829–2,902 USDT – Fibonacci support band and trendline retest zone
2,93x–2,96x USDT – Current demand; holding here keeps short-term structure bullish
3,021 USDT – Neckline resistance; breakout level for continuation
3,188–3,210 USDT – Shoulder resistance and main upside target for this swing
Trading Implications
As long as ETH remains above the rising trendline and 2.9K support, our bias is for a fractally bullish move within the range toward 3.0K–3.2K, while a clean break below 2,83x–2,80x would shift risk toward a deeper retest of the 2,775 daily low and invalidate the immediate long setup.
This content is for educational purposes only and is not financial advice or a recommendation to buy or sell any asset.