


ETH Marketcap / Ethereum
ETH Daily analysis 29 January 2026. Ethereum remains in a bearish market structure, with price currently pressing into higher-timeframe decision zones while the market waits for confirmation around the weekly line in the sand.
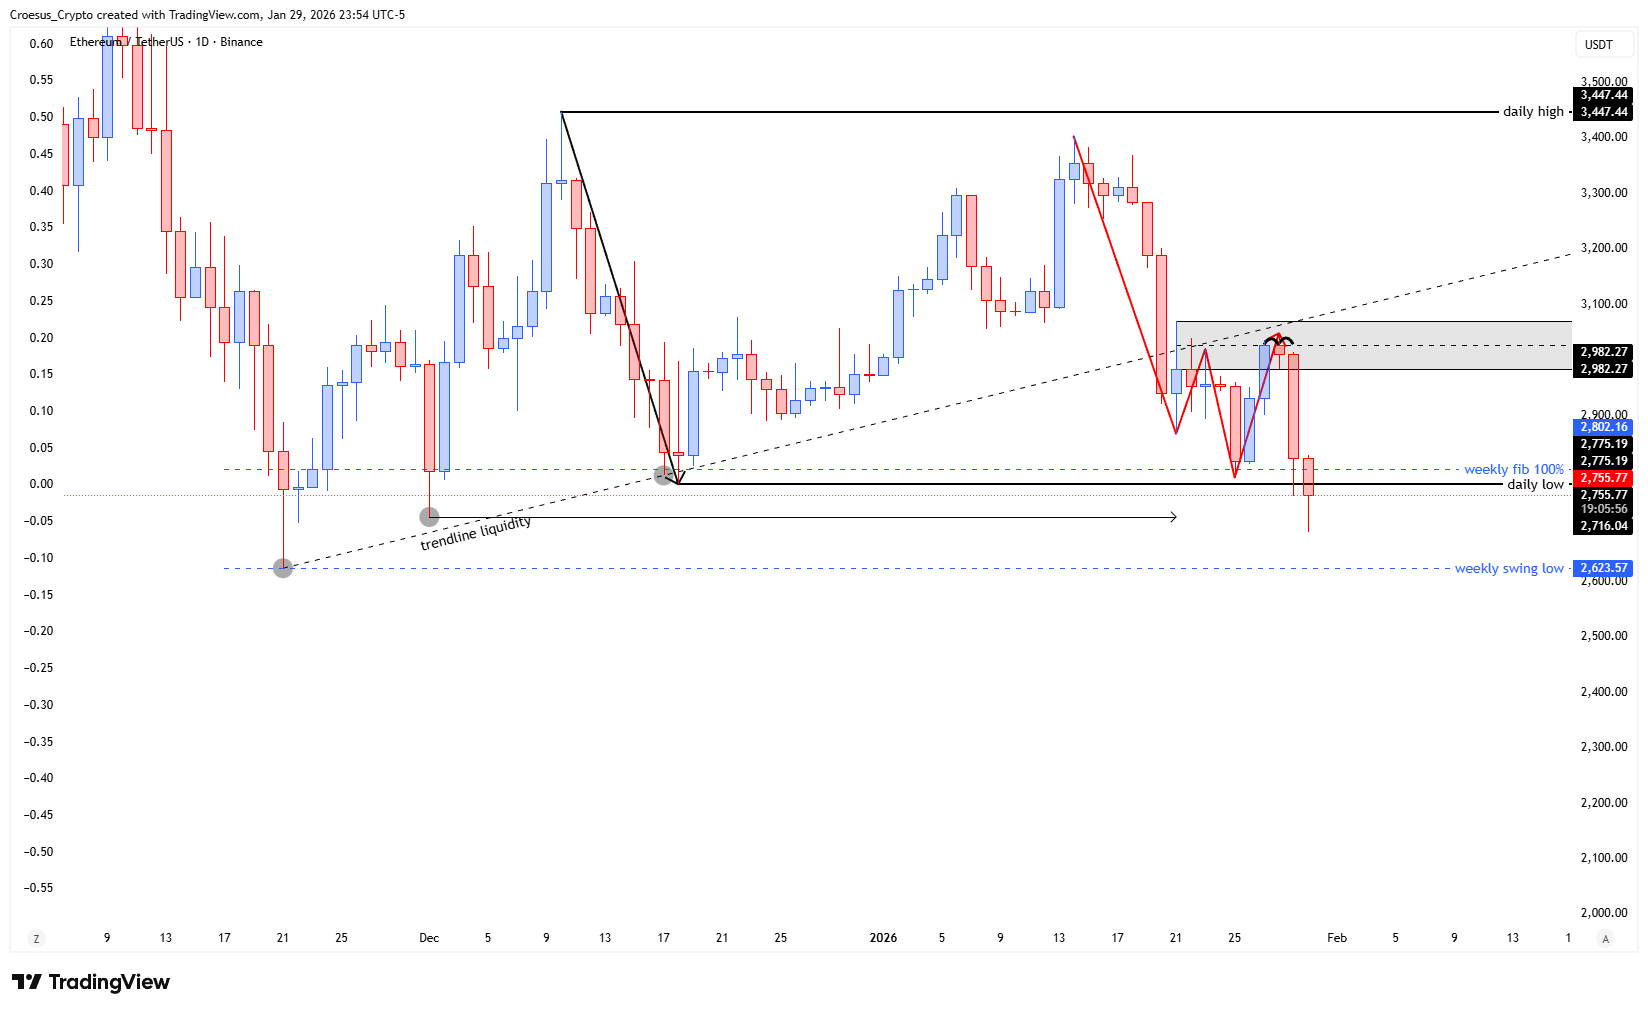
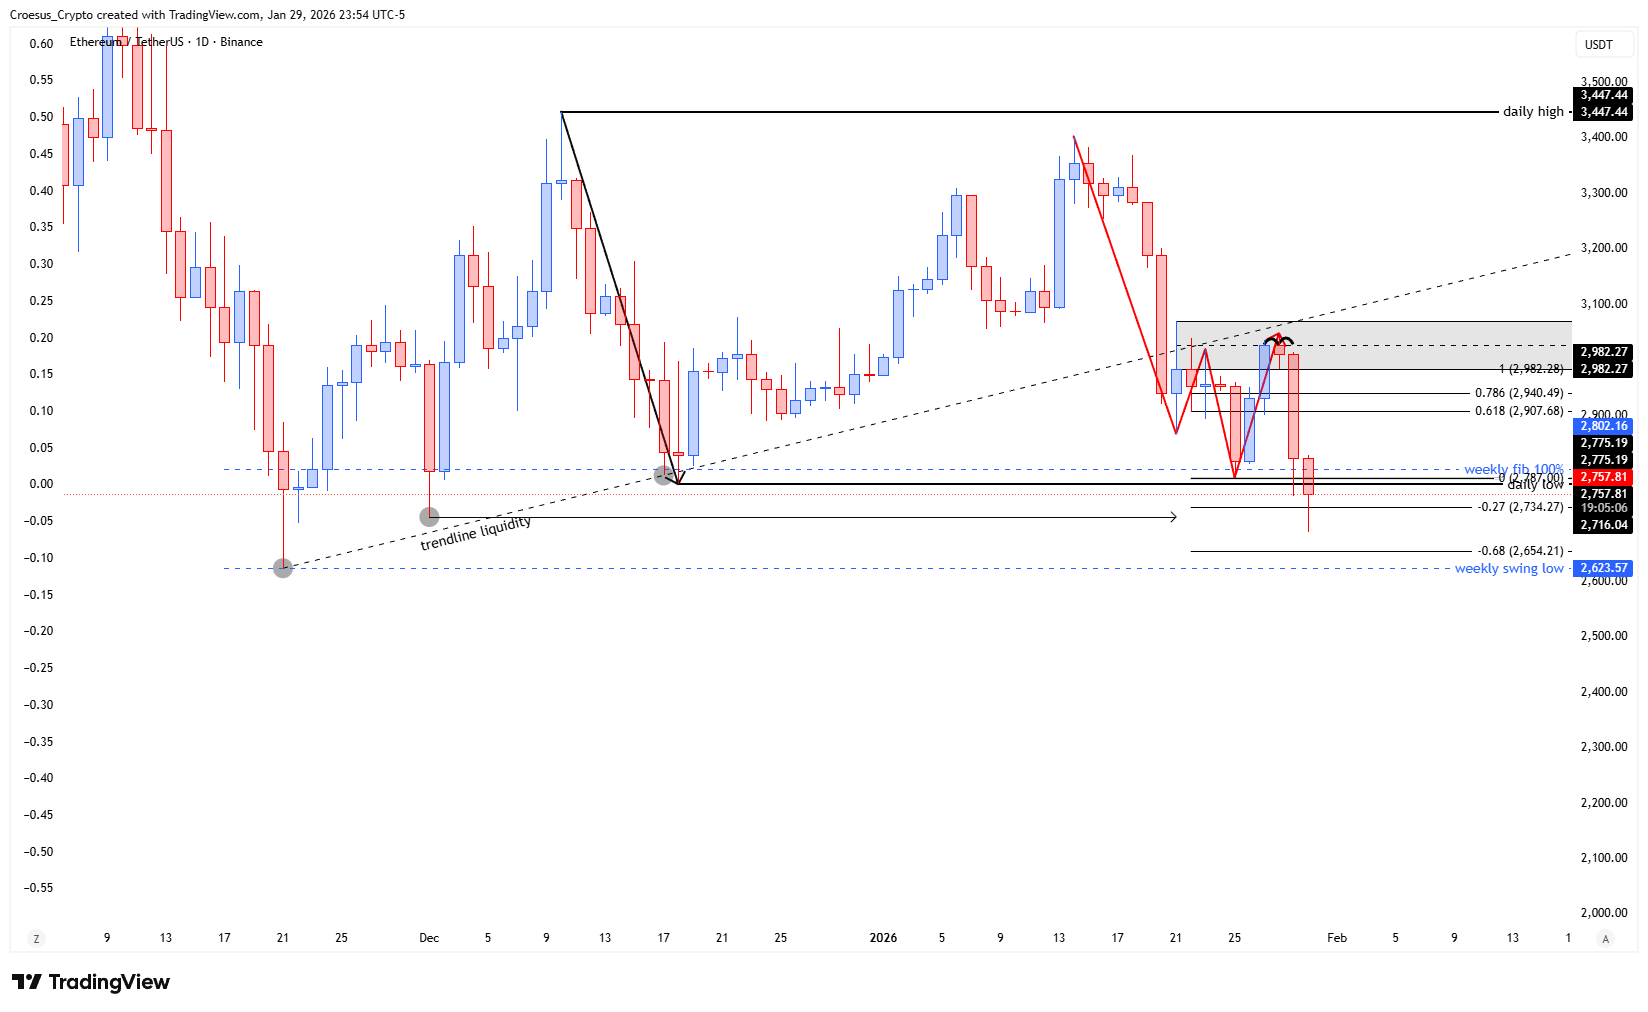
- After hitting the daily entry zone, the bearish W played out until the fib -0.27.
- The price putting pressure on the weekly fake out zone. The weekly swing low is the line in the sand for a weekly larger correction of the bearish impulse. Liquidity has been swept, one point remains untested and that is the weekly swing low. A sweep of that low might trigger a new action and initiate a possible bullish reversal.
Market Structure Analysis
Our ETH Daily analysis highlights a clean bearish continuation sequence: price reacted from the daily entry zone and followed through with the “bearish W” expansion into the fib -0.27, reinforcing downside control.
Structurally, this keeps the current move in a bearish impulse context until the market proves otherwise. The key development now is the interaction with the weekly fake out zone, where prior liquidity has already been swept. With one major pool still “untested” at the weekly swing low, the market is effectively compressing into a high-stakes support resistance area. If that weekly swing low is swept, it can complete the downside liquidity run and open the door for a larger corrective move against the bearish impulse, including the possibility of a bullish reversal trigger depending on follow-through and acceptance back above the weekly zone.
Key Levels and Scenarios
In this ETH Daily analysis, bearish continuation remains the base case while price holds below the weekly fake out zone. A bullish reversal narrative only becomes relevant if the market sweeps the weekly swing low and then shows a clear reclaim/acceptance back into the prior structure rather than continuation lower.
- Daily entry zone: origin of the latest bearish continuation leg
- Fib -0.27: current extension target already reached by the bearish W move
- Weekly fake out zone: overhead/nearby decision area applying structural pressure
- Weekly swing low: “line in the sand” level and remaining untested liquidity point
This analysis is for informational purposes only and does not constitute financial advice.