ETH Marketcap / Ethereum
ETH daily analysis 29/04/2026. Ethereum remains under bearish pressure after a volatile session driven by FOMC anticipation, and our ETH daily analysis continues to track a structured continuation lower while sellers keep control of the current swing.
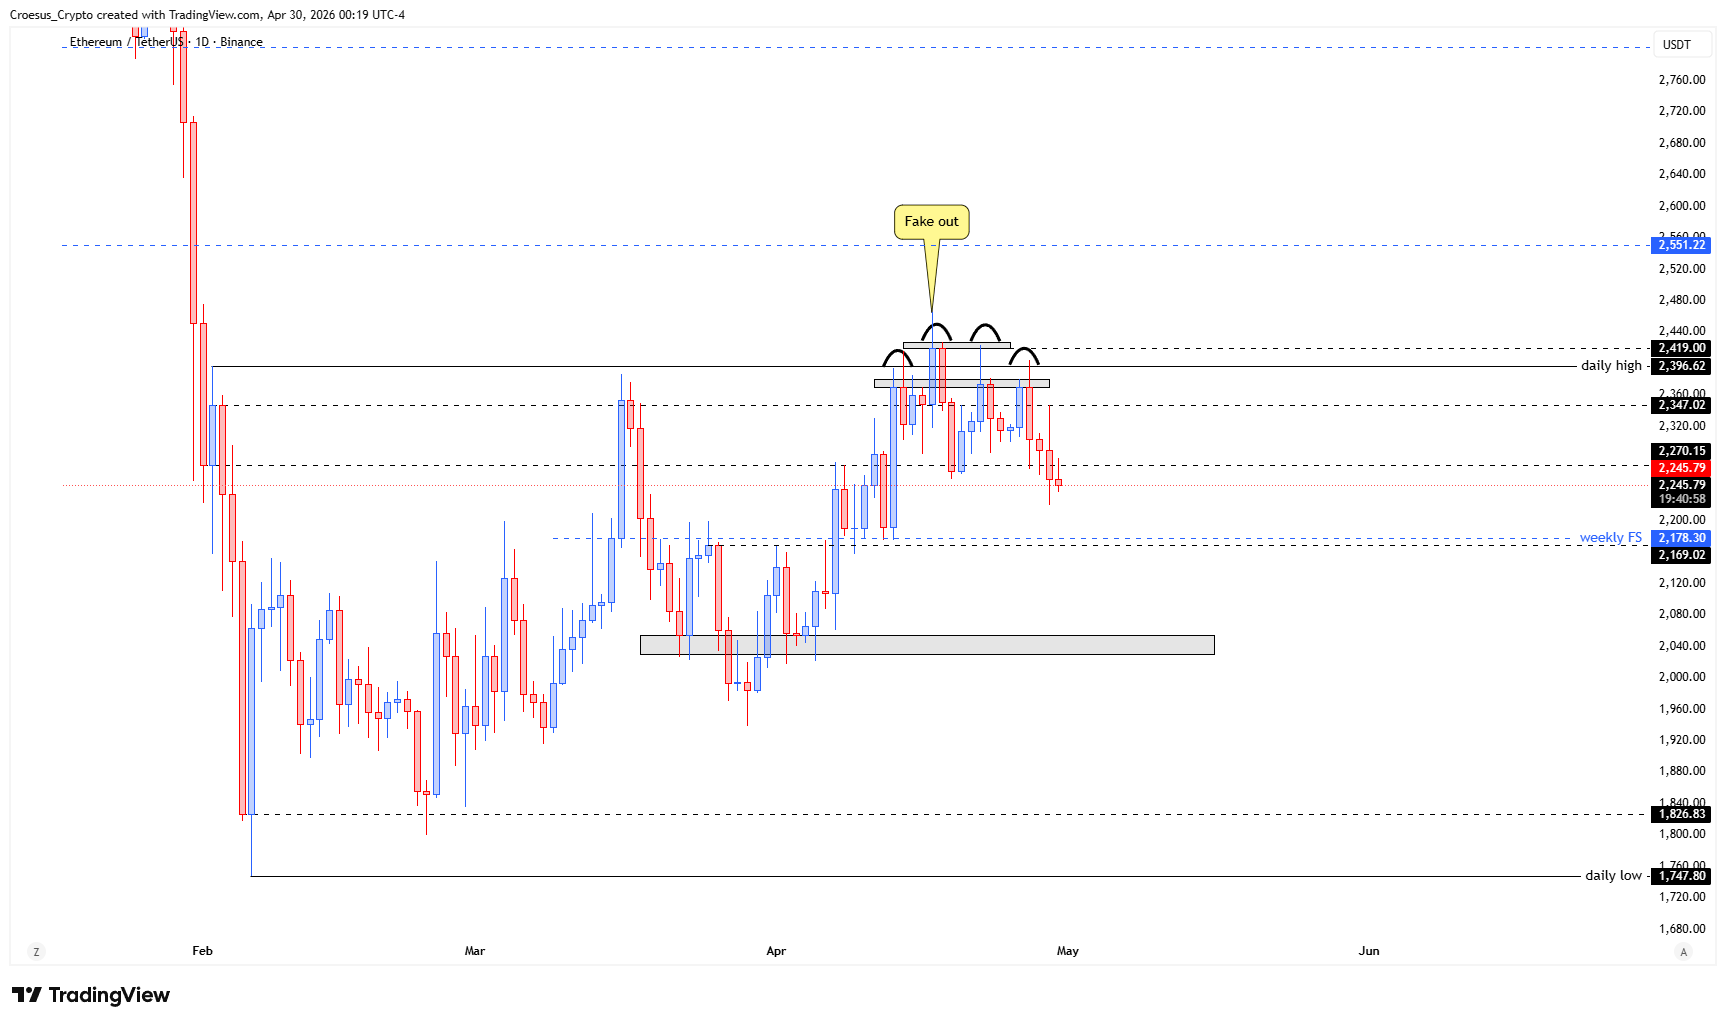
- ETH daily analysis shows us the price showing us a volatile day caused by the anticipation of the FOMC meeting, resulting in a bearish continuation.
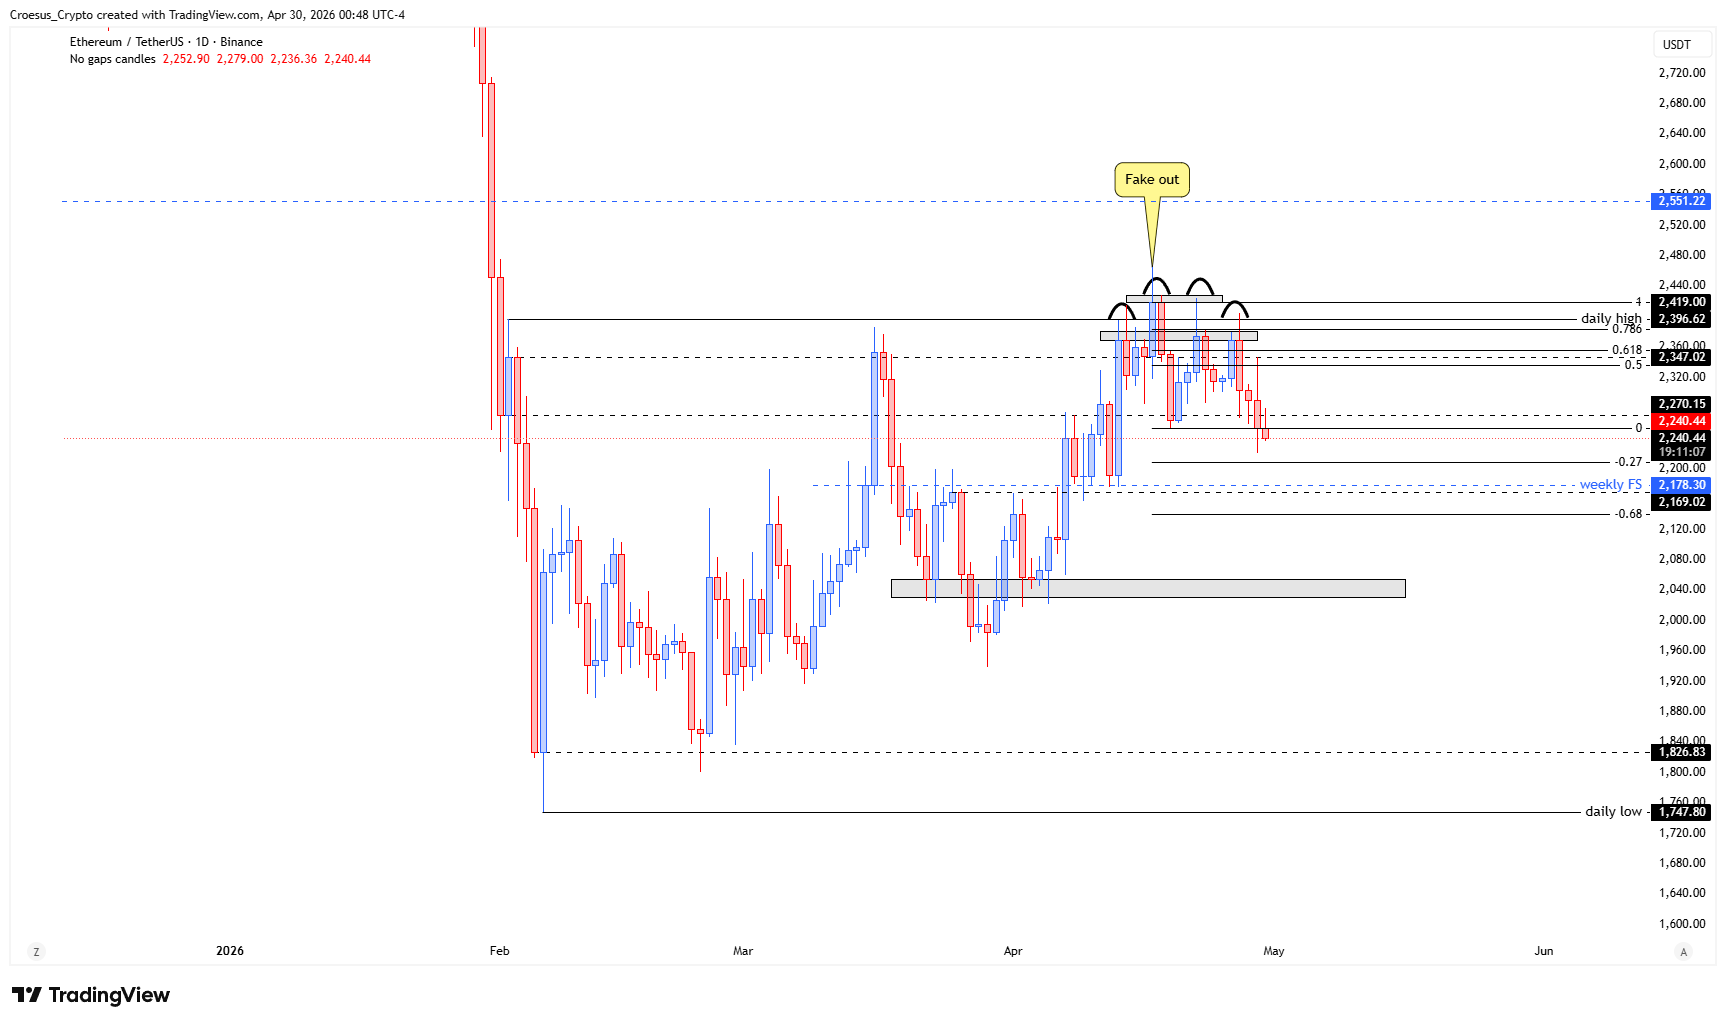
- The head and shoulders pattern continues to play out nicely approaching the -0.27 take profit level.
- For a bullish set-up we need to see a clear break and hold of the daily high.
- At this moment the head and shoulders pattern remains respected.
Market Structure Analysis
The dominant structure is a head and shoulders pattern that remains respected, meaning price is still honoring the key horizontal support resistance boundaries that define the shoulders, head, and neckline region. The FOMC-driven volatility reads as a liquidity event inside the larger bearish continuation: sharp intraday movement can sweep nearby stops, but structure matters most on the daily close. As long as price continues to reject attempts to reclaim the daily high and fails to hold above it, the market keeps printing lower continuation behavior consistent with the pattern’s playbook. In this context, the -0.27 take profit level acts as the next referenced downside objective within the active leg, while any meaningful shift would require a break of structure to the upside rather than a temporary wick.
Key Levels and Scenarios
ETH daily analysis remains bearish while the head and shoulders structure holds. A bearish continuation scenario stays in play if price continues to respect the pattern and cannot reclaim the daily high on a break-and-hold basis. The bullish alternative only becomes valid on a clear break and hold above the daily high, which would signal a potential structural shift and invalidate the immediate continuation pressure.
- Daily high: needs a clear break and hold to unlock a bullish set-up
- Head and shoulders structure: remains the active framework as long as it is respected
- -0.27 take profit level: referenced downside objective while the pattern plays out
This analysis is for informational purposes only and does not constitute financial advice.