


In this Ethereum daily analysis for late November 2025, we see price still trading inside a corrective structure after the last strong bearish push down. Our technical analysis focuses on the newly formed bearish orderblock at the daily entry zone, a possible developing head and shoulders on the daily chart, and a 4H structure that might be in the process of invalidating. Until proven otherwise, we treat current price action as a bullish correction within a broader bearish context.
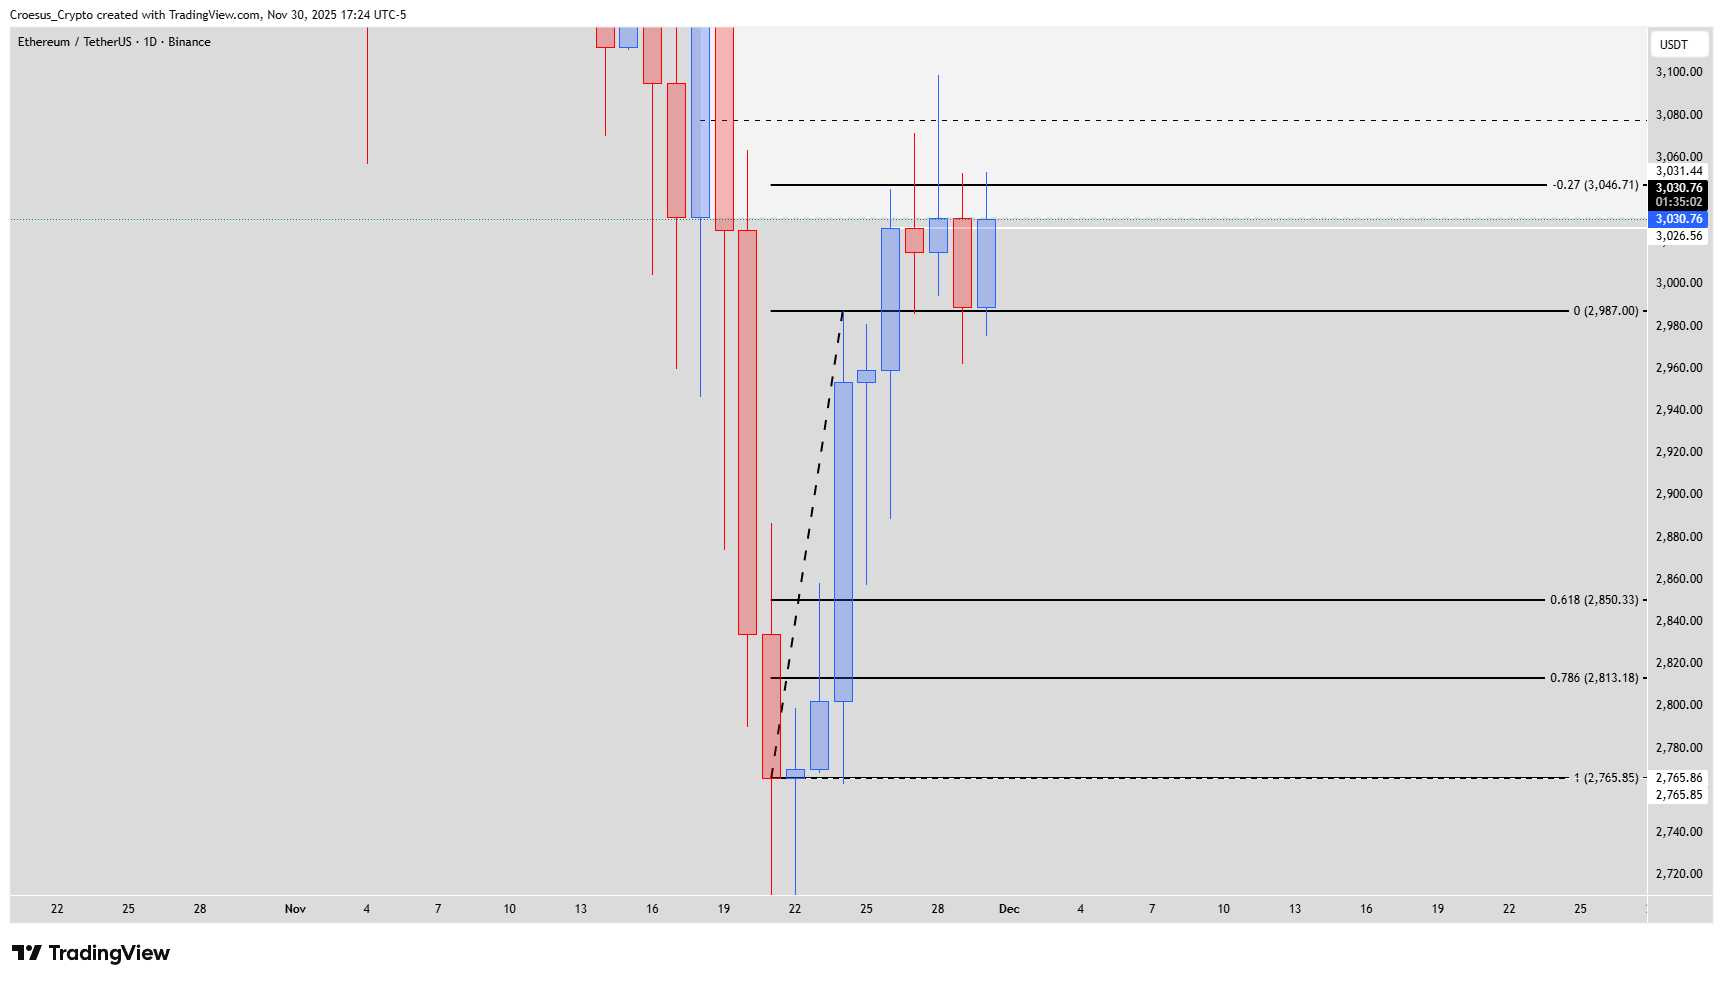
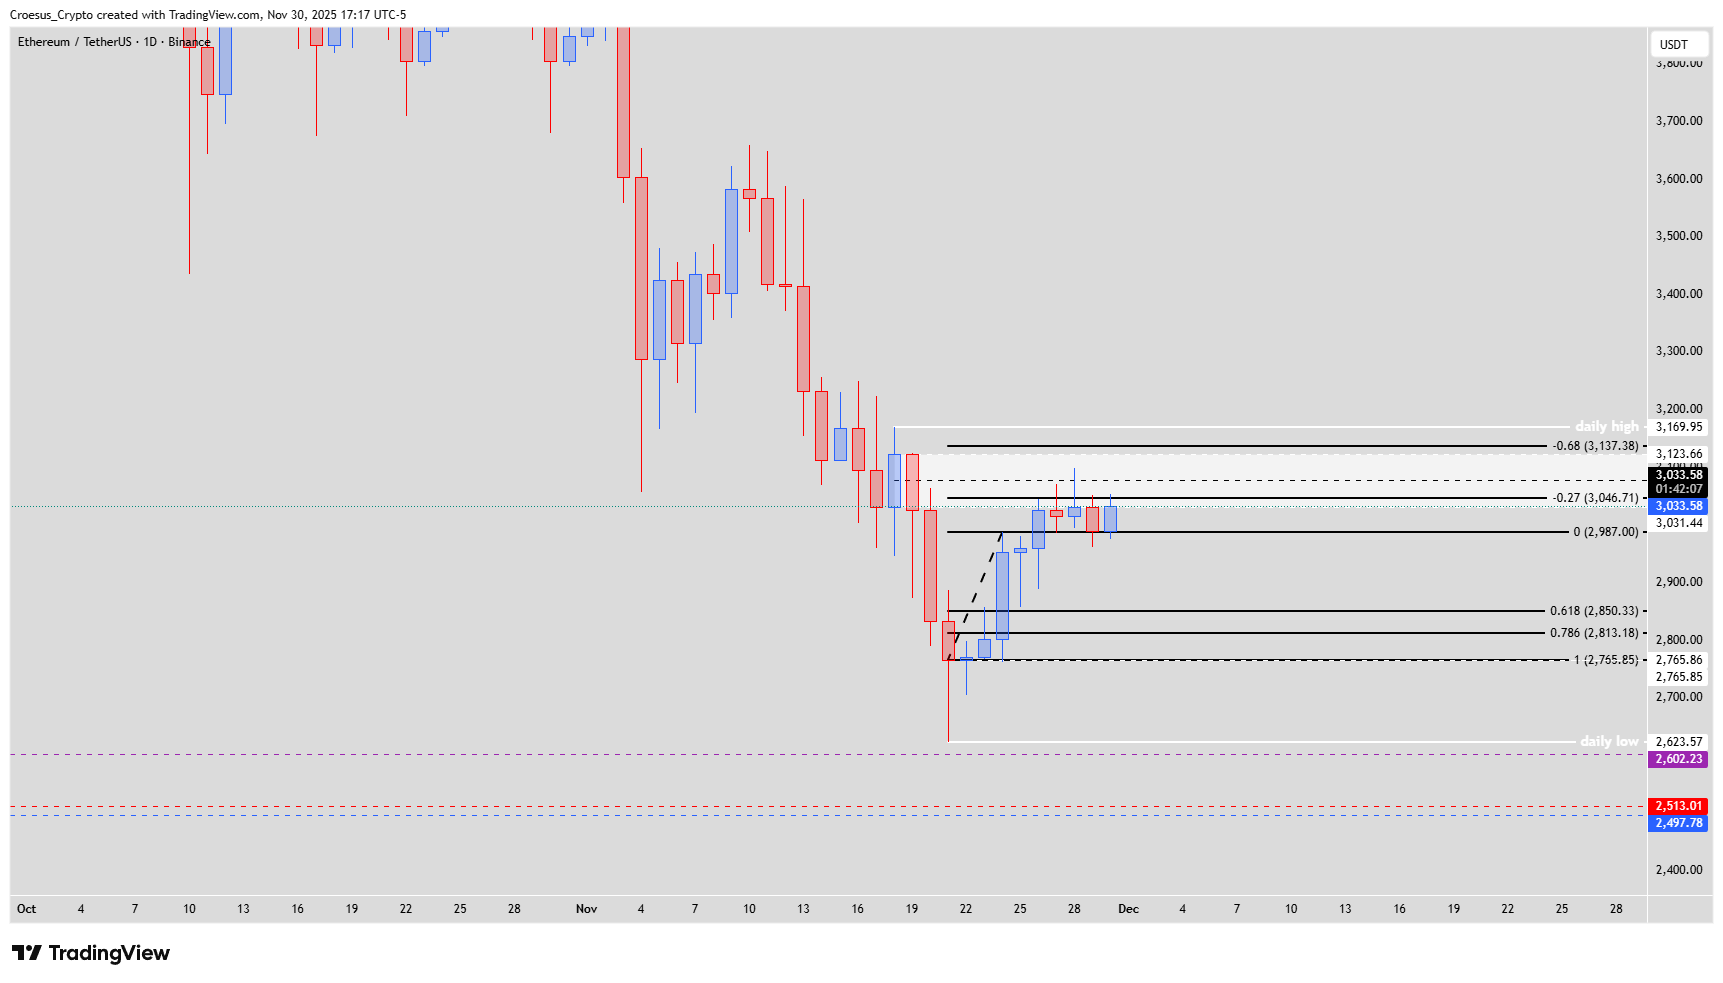
Ethereum daily chart 30 Nov 2025 with ABC leg and Fibonacci retracement and extension levels.
Trend = bearish ↓
Technical Analysis Key Points
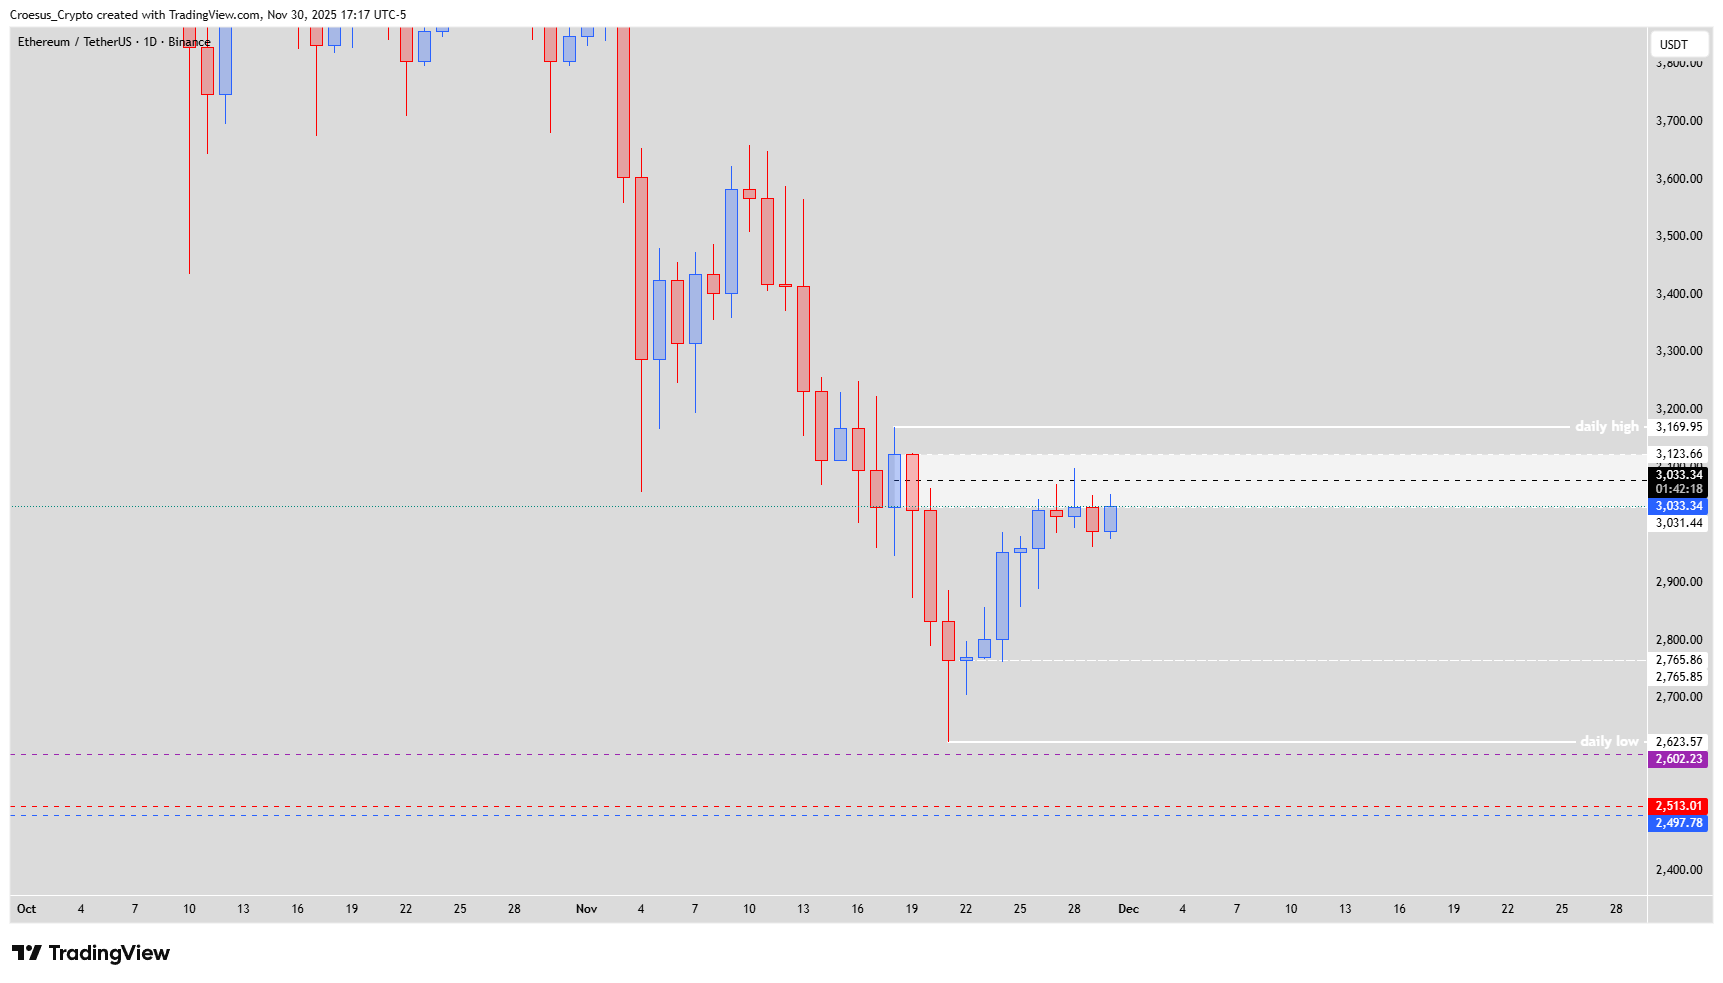
- Where price tested the daily entry zone for the third time, it reversed on Saturday, creating a bearish orderblock.
- Today we saw a retest of that bearish orderblock, but no break of it.
- If we can not close above 3,026.56 $, price is creating also a head and shoulders on the daily indicating potential further downside.
- We still have to take into account that the -0.68 daily extension has not been hit yet. This could still act as an upside magnet.
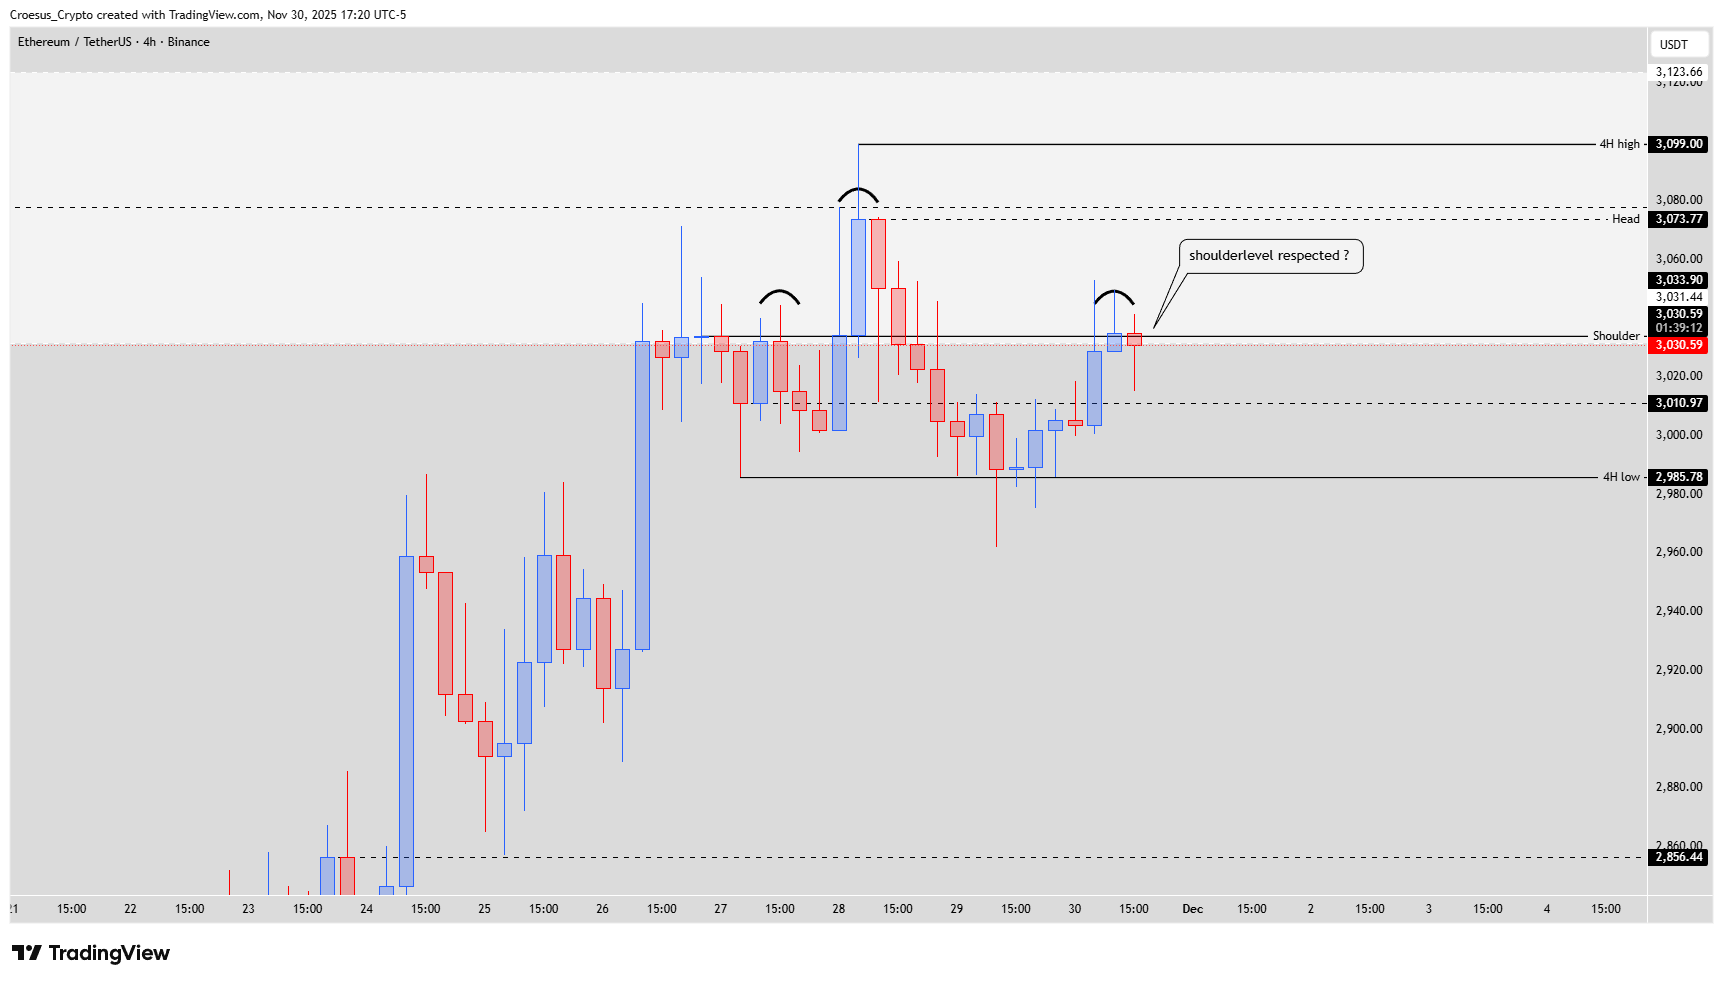
- If we zoom in on the 4H timeframe, we can see that price hit the 4H shoulder level but on the second test closed slightly above that level, thus not respecting it. Could this indicate that the head and shoulder is invalid and we can see further upside, touching -0.68 fib level still ?
- This price action still needs to be considered as a bullish correction of the last bearish push down
- In order to see a bullish reversal the daily high @ 3,169.95 $ needs to be reclaimed and defended.
Market Structure Analysis
Structure-wise, ETH is ranging around the daily entry zone after a sharp selloff, with the third tap producing a bearish orderblock that now acts as clear resistance in terms of support resistance rotation. As long as daily candles fail to close above 3,026.56 $, the risk of a completed daily head and shoulders remains in play and favours renewed downside.
At the same time, the unfilled -0.68 Fibonacci extension above current price still acts as a potential upside magnet within this correction. The 4H chart shows that the shoulder level has been marginally pierced on the second test, which may be an early sign that the intraday head and shoulders is losing validity and that buyers could push price higher into that extension before any larger reversal.
Key Levels and Scenarios
Bullish scenario: if ETH can close decisively above 3,026.56 $ and then extend toward the -0.68 daily extension, we could see a full tag of that Fibonacci level before sellers return.
Key levels to watch:
3,026.56 $ – key daily orderblock and potential neckline for the head and shoulders.
-0.68 daily extension – upside magnet if 3,026.56 $ is reclaimed.
Daily entry zone – main resistance area created after three tests.
4H shoulder region – loss or clean reclaim will help confirm H&S validity or invalidation.
3,169.95 $ – daily high that must be reclaimed and defended for a proper bullish reversal.
Trading Implications
For now, we see asymmetric risk: failed closes above 3,026.56 $ favour short setups into the broader bearish trend, while aggressive longs would only look for continuation toward the -0.68 extension with tight risk if the 4H H&S is clearly invalidated and price holds above the orderblock.
This publication is for educational purposes only and does not constitute financial advice or a recommendation to buy or sell any asset.