


ETH Marketcap / Ethereum
ETH daily analysis 31/03/2026. Ethereum is showing a small bullish reaction at a key shoulderlevel, but our technical analysis remains cautious because the broader context still allows both a continuation push and a larger bearish reversal to develop.
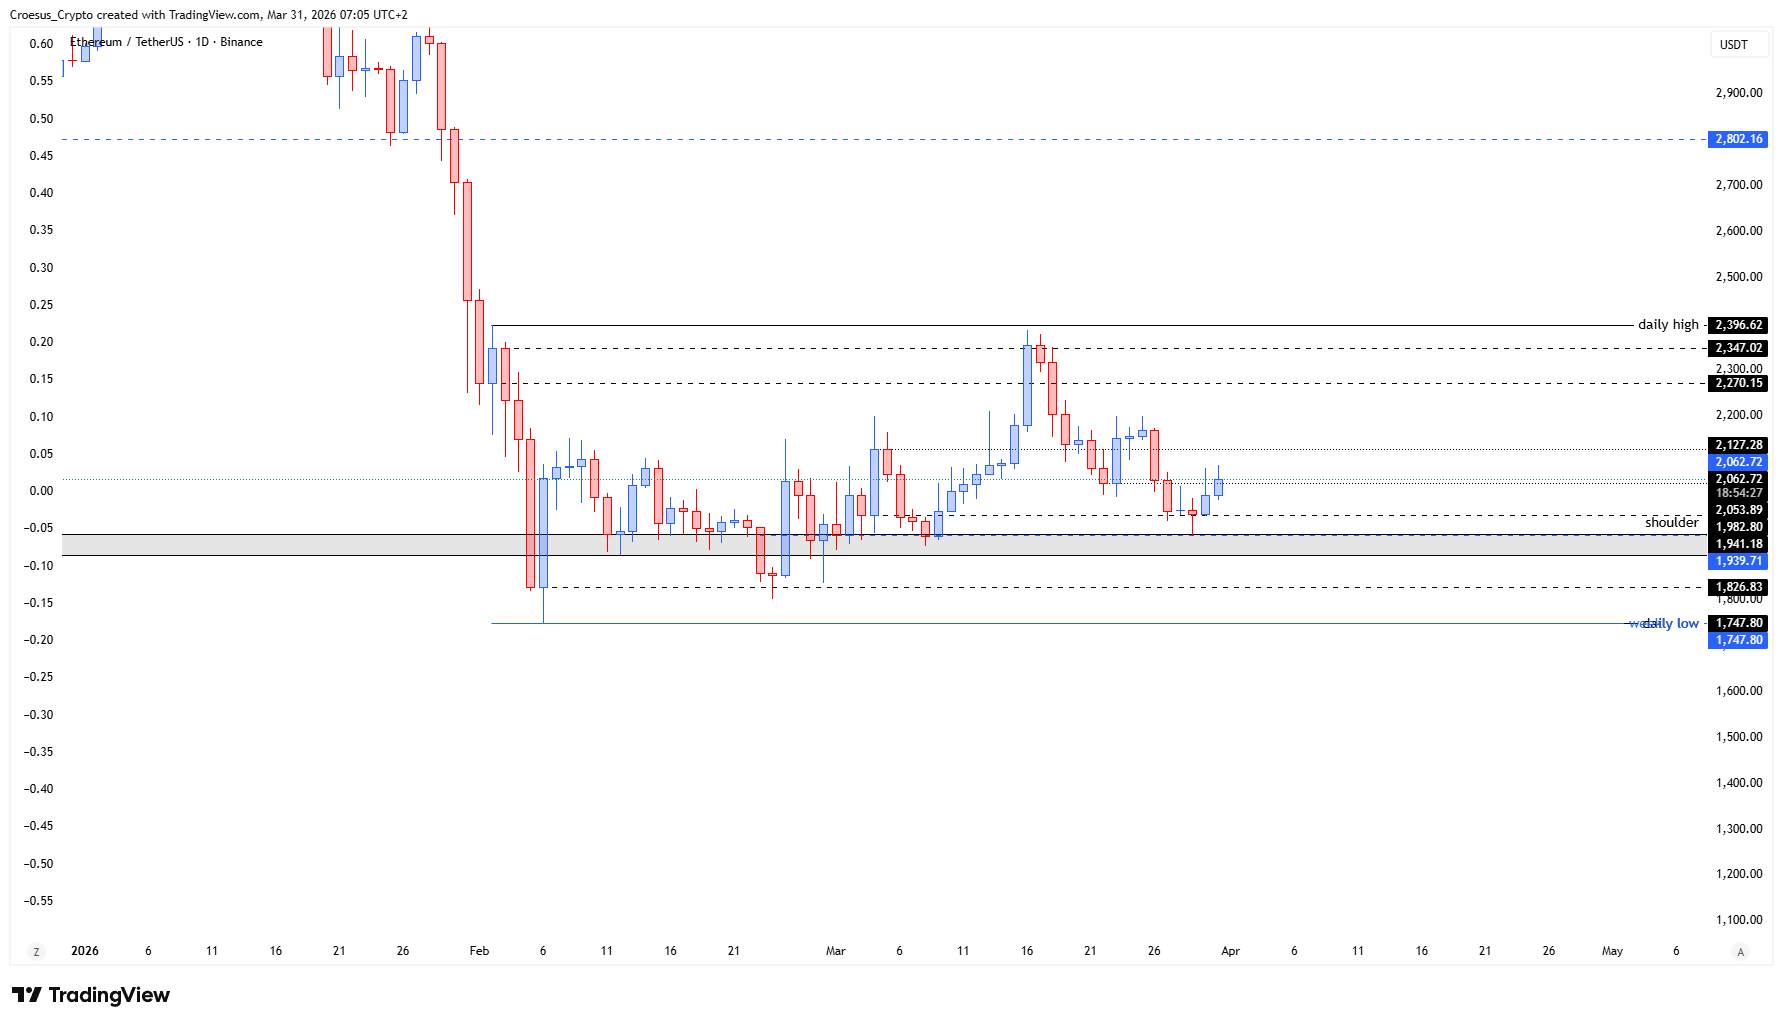
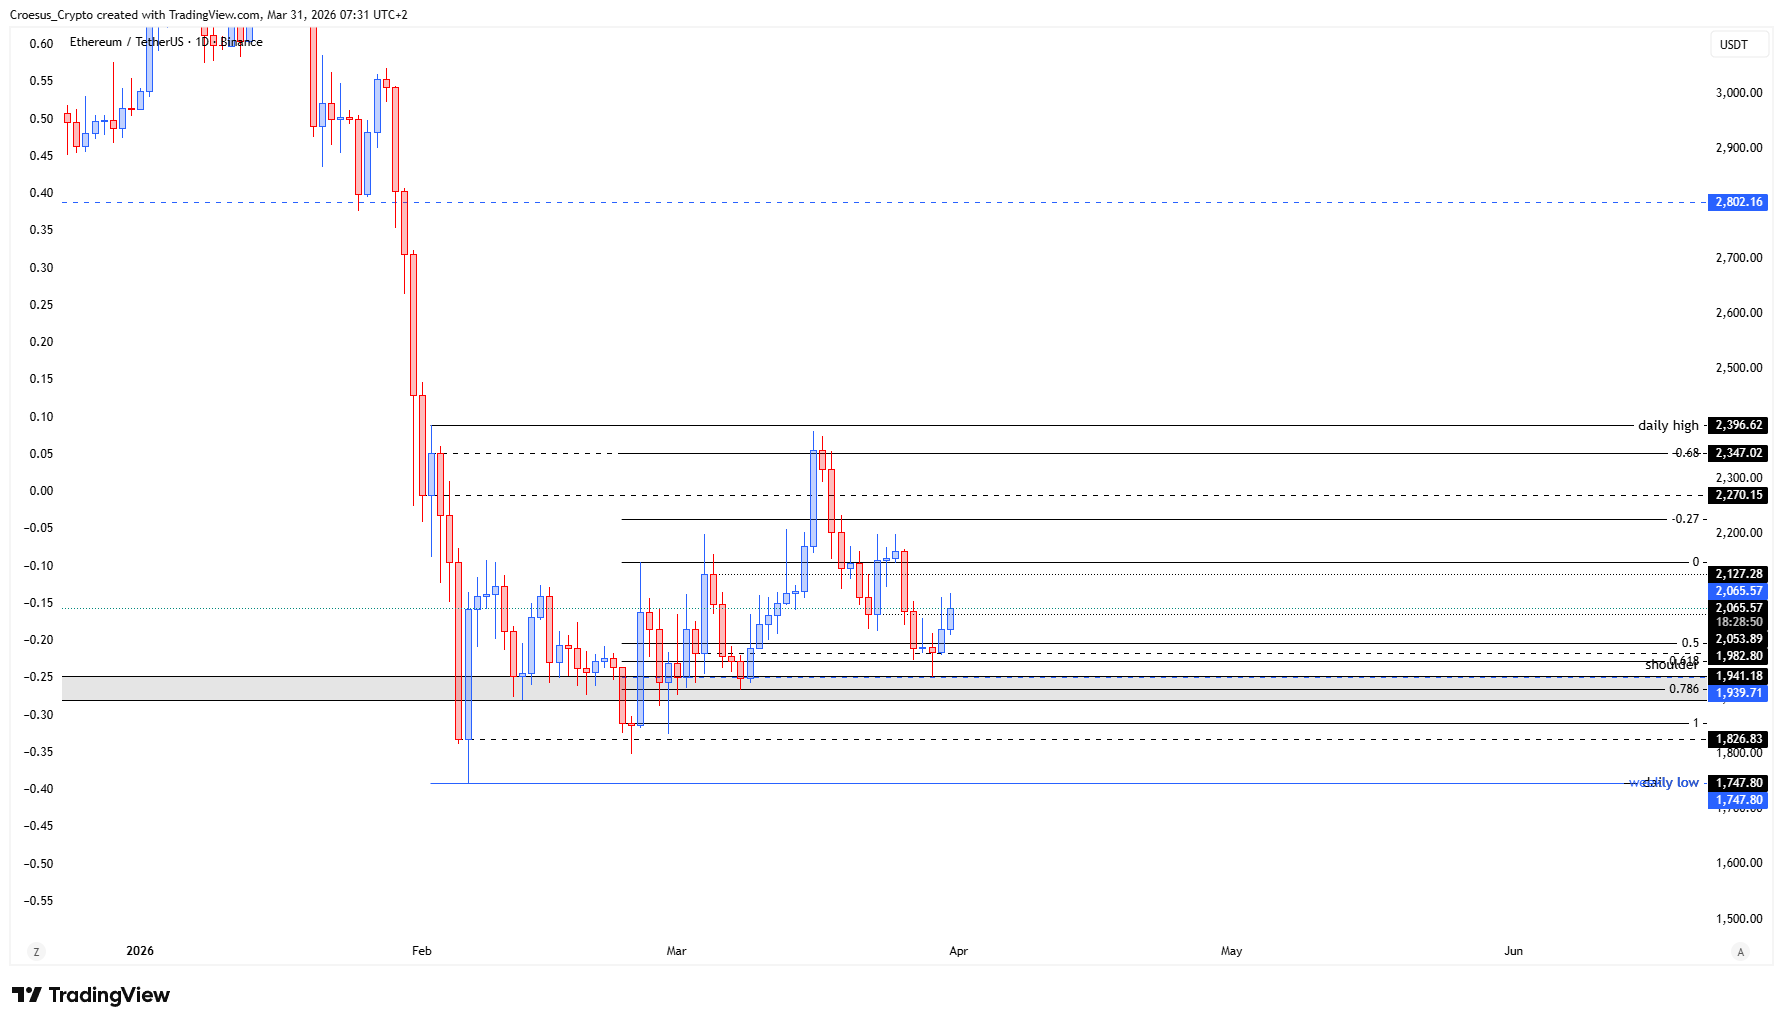
- The ETH price shows us a minor bullish reaction upon touching the shoulderlevel
- But we have to remain neutral and investigate both directions :
- Bullish : we can hold the shoulderlevel as support and build up further strength to attack the daily highs and even break them
- Bearish : the current inverse head and shoulders set-up has played out (the -0.68 level has been hit). We can possibly see a head and shoulders forming. Where we have now our iHS shoulderlevel, this could be our new H&S neckline and the prior fractal highs @ 2127,28 $ could be our H&S shoulderlevel. We have keep a sharp eye on this possible shoulderlevel how the price reacts there.
Market Structure Analysis
From a market structure perspective, ETH daily analysis focuses on whether the current shoulderlevel is acting as real support resistance (support now) or just a temporary pause inside a bearish sequence.
The minor bullish reaction suggests buyers are defending that zone, but we still need to see follow-through strength into the daily highs to confirm an impulsive response rather than a corrective bounce.
On the bearish side, the notes mention the inverse head and shoulders has played out after tagging the -0.68 level, which increases the risk that price transitions into a topping structure. If a head and shoulders begins to form, the current iHS shoulderlevel becomes a structurally important line: it can shift from support into a neckline that guides the next breakdown/retest behaviour.
Key Levels and Scenarios
In this ETH daily analysis, bullish continuation requires holding the shoulderlevel and reclaiming the daily highs to prove buyers can build a new impulse. Bearish continuation strengthens if price fails to break the daily highs and starts respecting the current iHS shoulderlevel as a neckline, especially if reaction near the prior fractal highs weakens.
- Shoulderlevel (current) — key support; failure here increases neckline risk
- Daily highs — overhead resistance; reclaim/break supports bullish continuation
- -0.68 level — prior objective already hit; raises odds of structure transition
- 2127,28 $ — prior fractal highs; potential H&S shoulderlevel reaction zone
Trading Implications
Bias management is critical: aggressive traders typically treat the shoulderlevel as the decision point, while conservative positioning usually waits for a clear break and retest of either the daily highs (bullish confirmation) or the neckline logic (bearish confirmation). Keep risk tight around these structural inflection zones.
This analysis is for informational purposes only and does not constitute financial advice.