


ETH Marketcap / Ethereum
In this ETH daily analysis for 24 February 2026, Ethereum has completed a clean Fibonacci 100% retracement of the previous A-leg, tagging our predefined daily entry zone. From here, our technical analysis focuses on whether buyers can defend this area and trigger a corrective bounce back toward the daily high, or if bearish pressure resumes in line with the dominant higher-timeframe trend.
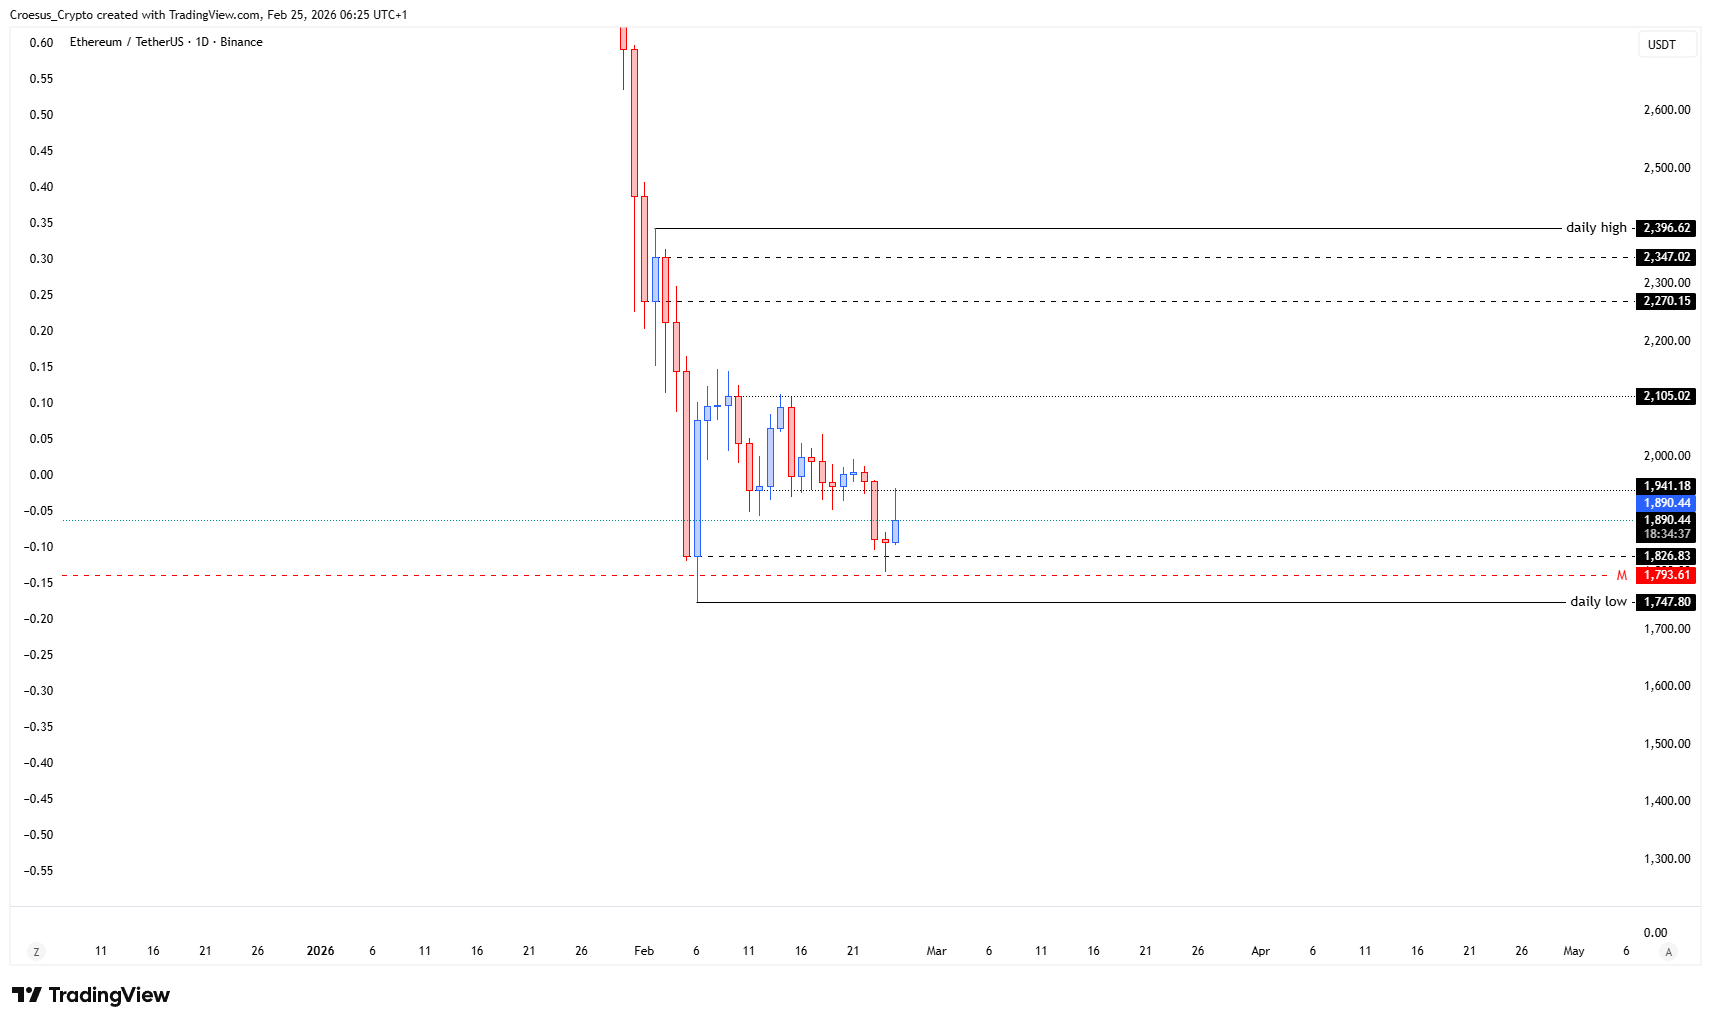
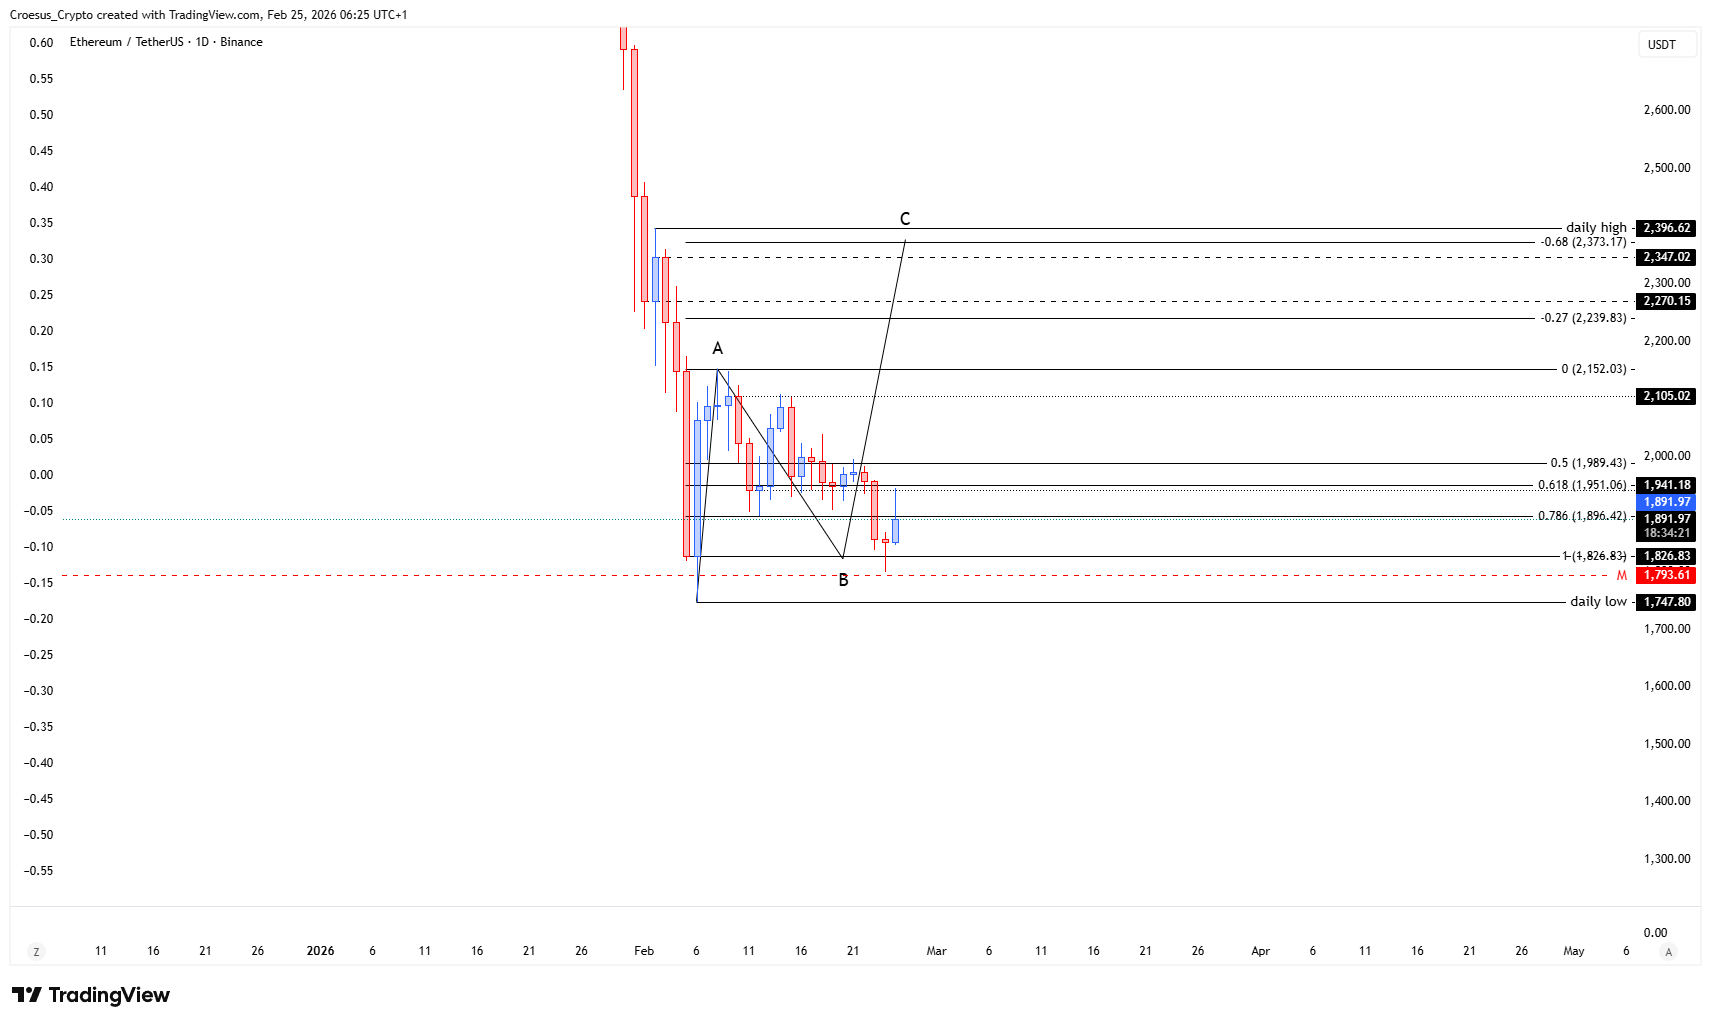
- ETH showed us a fib 100% retracement of the A-leg, hitting our daily entry zone.
- if the pattern plays out, we could potentially see a bullish move up towards the daily high
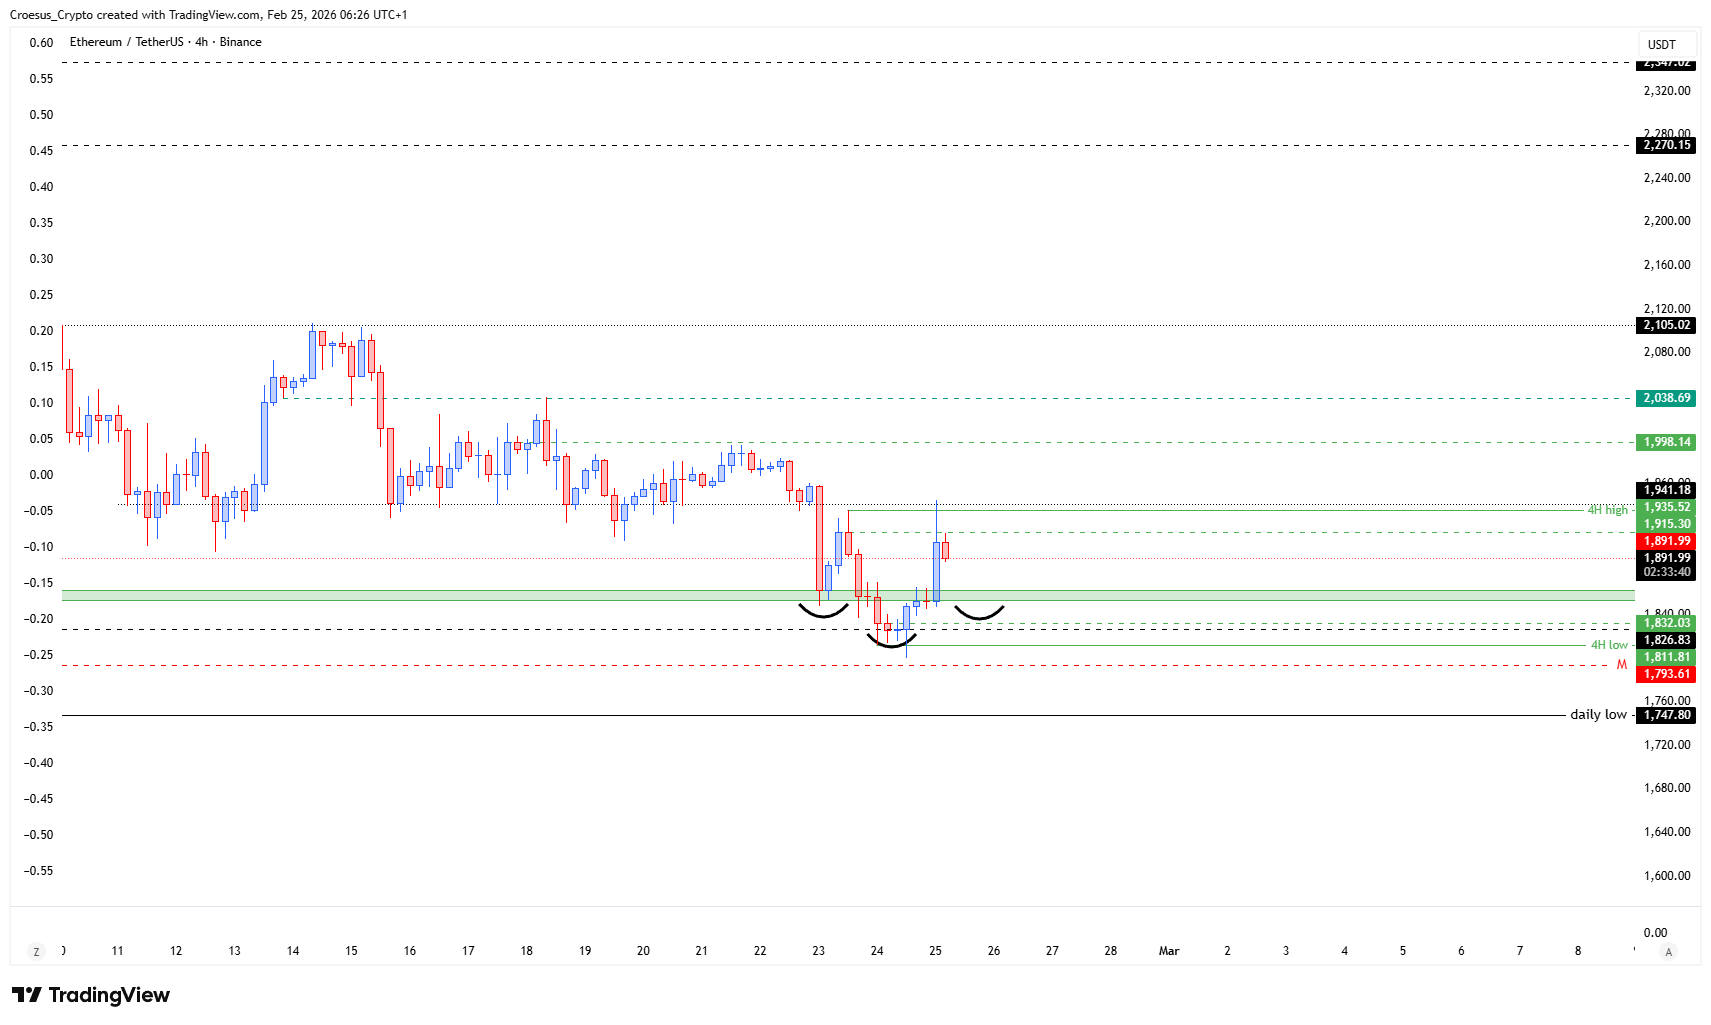
- When we zoom in on the 4H chart, we can see a potential formation of an inversed head & shoulders pattern. At this moment though, we don't have a break of structure yet on the 4H. As long as we don't see a close above the current 4H High, we are still in a bearish marketstructure. An entry here on the shoulderlevel is possible with a thight stoploss, but still remains higher risk. Weekly and daily still remain bearish, 4H is bearish. We would like to see some more confirmation at this moment.
Market Structure Analysis
Our ETH daily analysis frames the current move as a completed A–B sequence, with point B aligning with a full Fibonacci 100% retracement and a key support resistance zone. This confluence creates a tactical decision point: either the market begins an ABC corrective structure to the upside, or the rejection here extends the broader downtrend.
On the 4H chart, the potential inverse head & shoulders is developing right at the daily entry zone, but without a confirmed break of structure above the 4H high, the pattern remains unconfirmed. Weekly, daily, and 4H all still print lower highs and lower lows, underlining that any long idea here is counter-trend and purely corrective for now.
Key Levels and Scenarios
Bullish scenario: a 4H close above the current 4H high/neckline would confirm a short-term structure shift and open room for an ABC-style rally toward the daily high, with intermediate pauses at prior intraday supply zones.
Critical levels to watch:
- $1,747 (daily low) – Primary downside invalidation; loss suggests the C-leg is starting.
- 1,775–1,826 – Short-term support and pivot; holding here keeps the B-leg thesis alive.
- 2,100 – Mid-range resistance and first objective for any bounce.
- 2,270–2,347 – Major resistance cluster, ideal zone to monitor for B-leg exhaustion
- 2,396 (daily high) – Key macro resistance; only a sustained break would weaken the broader bearish structure.
Trading Implications
Aggressive longs from the shoulder zone can be considered only with tight stop loss placement below local 4H support, reduced position sizing, and a clear plan to scale out into each resistance layer while we wait for a decisive break in bearish market structure.
This analysis is for informational purposes only and does not constitute financial advice.