


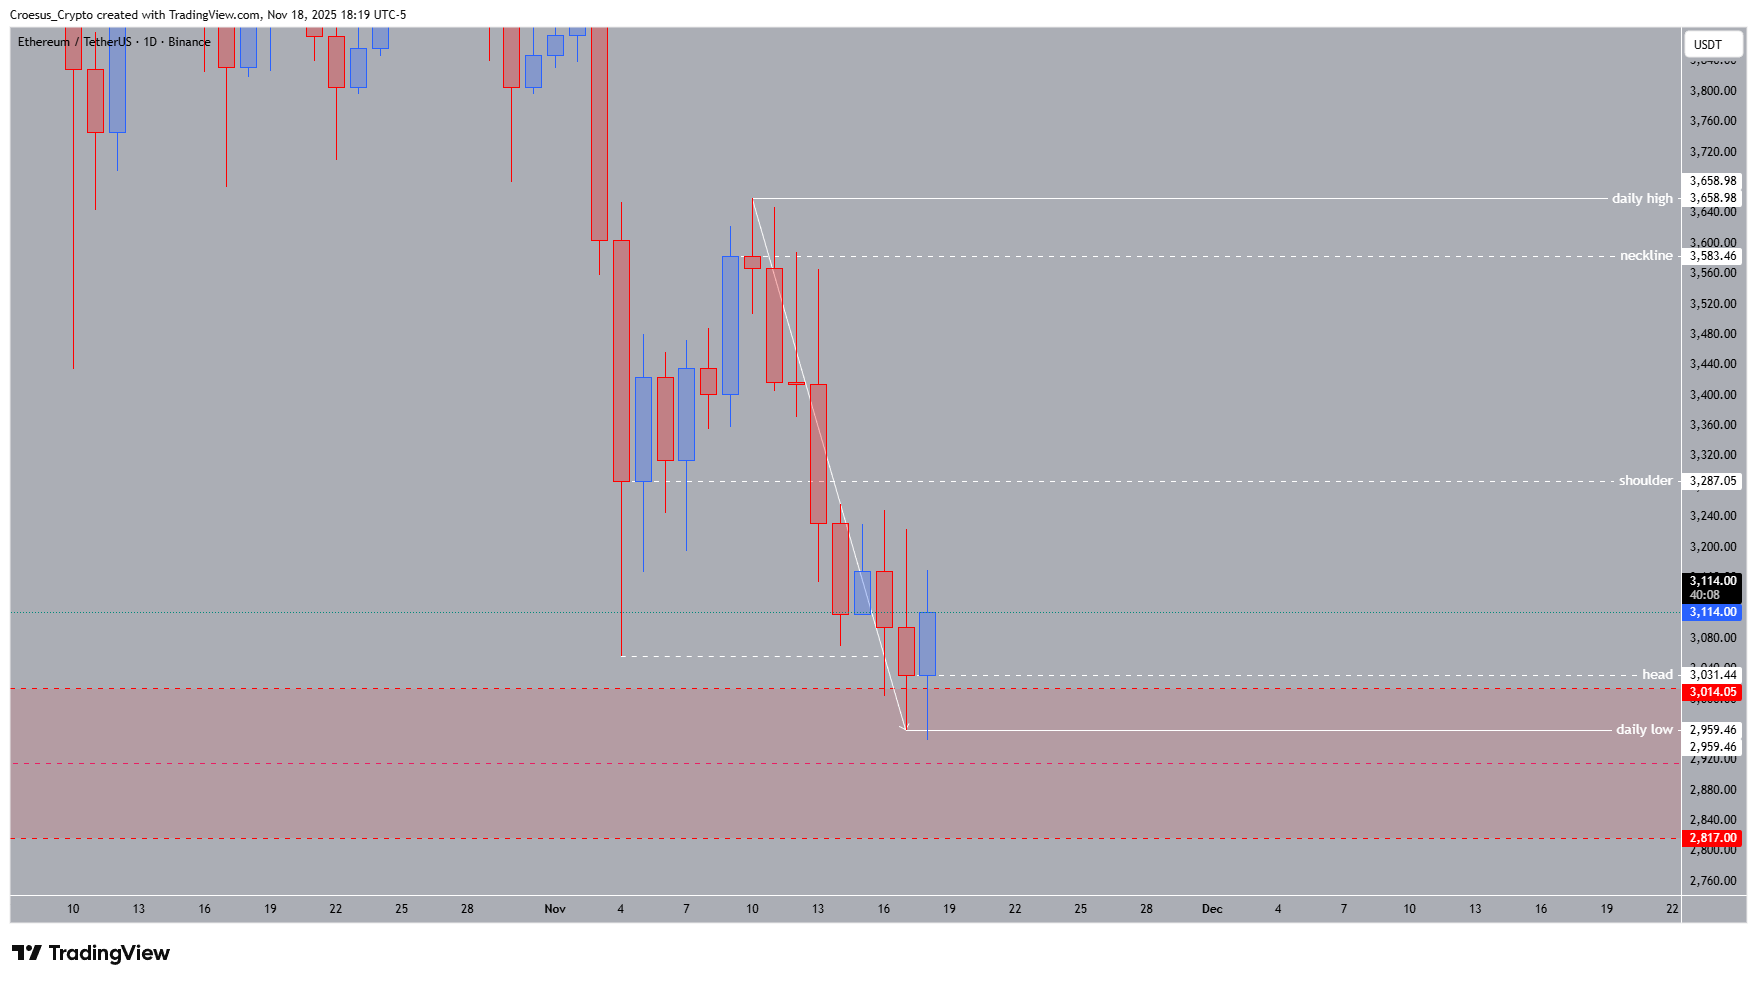
ETH daily chart 2025-11-18 showing monthly liquidity sweep, bearish retest and key daily levels
- Trend = bearish ↓
- Technical Analysis Key Points
- Upon touching the monthly low, price pierced the monthly liquidity zone but closed back above the low.
- Eventhough the bullish candle today seems to be a positive sign, it is a bearish retest of a bearish orderblock. We could see a retest of the lows or even a lower price.
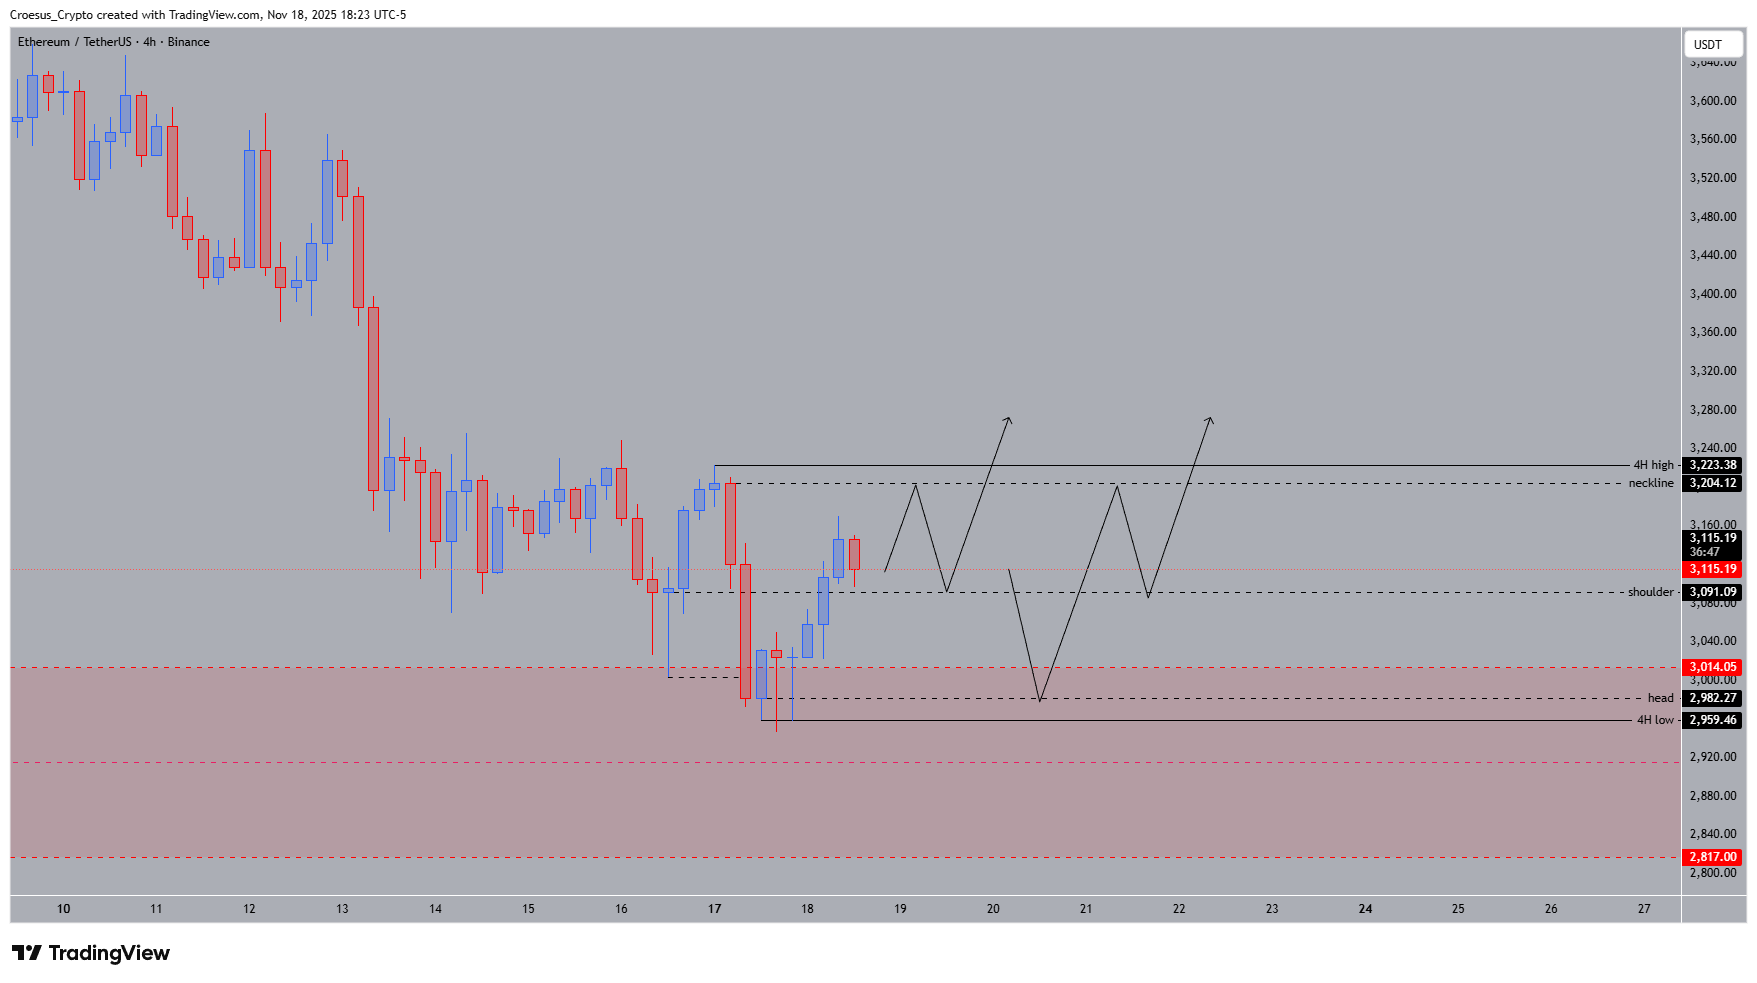
- If we zoom in on the 4H chart, we could see a inverse head and shoulder but we still have to remain aware of the nature of the candles. The last bearish move was constructed with two candles. The bullish move that followed, has still not made that bearish move and it consists already of 7 candles. This means that bulls showed some good intentions but couldn't persist and are slowing down.
- Still no convincing signs of reversal. Possibilities are present but still need some time for further development
Market Structure Analysis
ETH tapped the monthly low and briefly pierced the monthly liquidity zone before closing back above it, creating a classical liquidity grab. This kind of reclaim typically signals the presence of strong demand, but in the current daily structure, the reaction is still unfolding inside a broader bearish trend. The candle that reclaimed the low retested a bearish orderblock, making the bounce susceptible to fading.
To confirm a structural shift, ETH must reclaim the daily high at 3,658.98 $, which is the top of the current range and the level that defines whether the bearish sequence continues.
The first structure at 3,287.05 $ remains the initial resistance area, and until ETH can flip it into support, bearish pressure dominates the higher timeframe.
ETH 4H chart 2025-11-19 showing potential inverse head & shoulder and slowing bullish momentum
Key Levels and Scenarios
Critical levels to watch
3,658.98 $ – Daily high: Key breakout requirement
3,287.05 $ – First structure: Major resistance, must flip
3,031.44–3,014.05 $ – Head zone: Liquidity pocket
2,946.56 $ – Daily low: Main downside target
2,817.00 $ – Lower liquidity: Possible sweep zone
Bearish scenario
Retest of the daily low or deeper liquidity remains the dominant probability unless ETH breaks through first structure with momentum.
Bullish scenario (early)
Only activates if the 4H pattern confirms with a neckline break and a daily close above first structure.
Trading Implications
Momentum is weak, structure is bearish, and any long position here carries elevated risk until daily closes reclaim key levels.