


ETH daily chart 2025-11-19 - remaining bearish but closing above the daily low
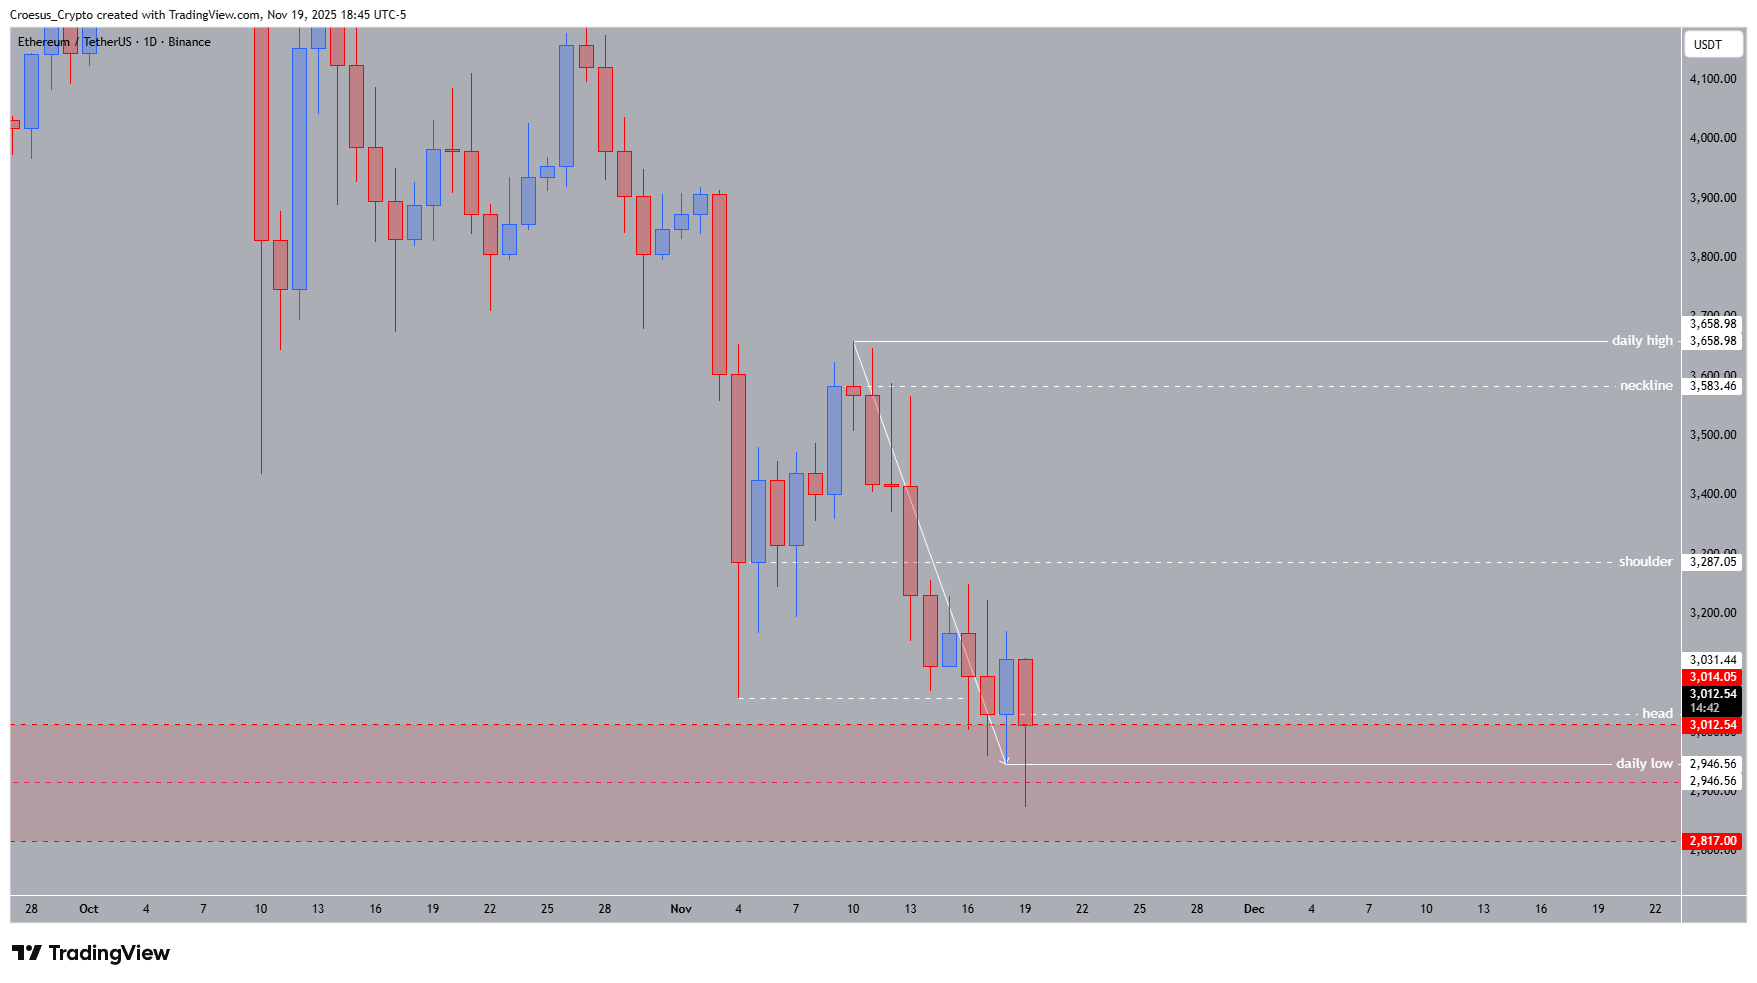
- Trend = bearish ↓
- Technical Analysis Key Points
- After being rejected at the prior lows yesterday, the bears continued pushing further down, retesting the daily low and the equilibrium of the monthly liquidity zone.
- The daily low remained respected, but still no signs of reversal.
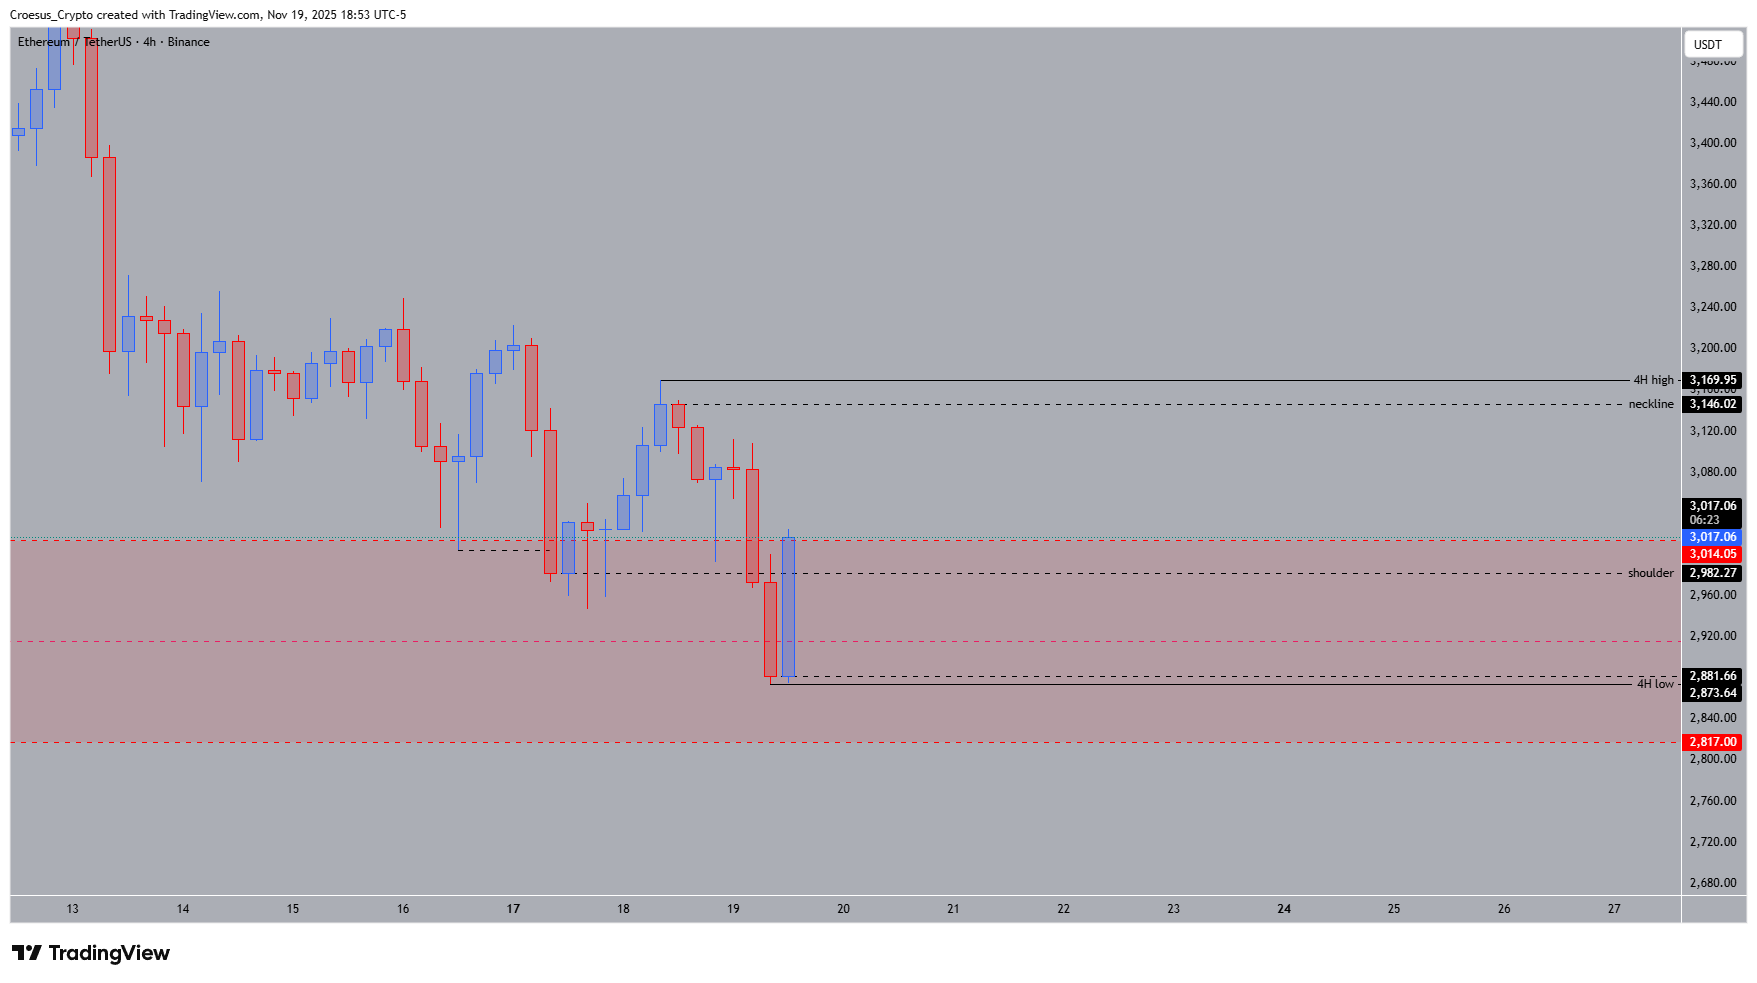
- If we zoom in on the 4H chart, we see that price remains bearish, printing a new lower low.
- Still no convincing signs of reversal. Possibilities are present but still need some time for further development
ETH 4H chart 2025-11-19 remaining bearish after printing a new lower low
Market Structure Analysis
ETH continues to trade within a clean bearish structure on the daily timeframe. Yesterday’s rejection from prior lows extended the downside pressure, driving price back into the lower part of the monthly liquidity zone. Although the daily low held, the reaction remains weak and does not yet signal a structural shift. The market is still positioned in the lower range of the zone’s equilibrium, showing hesitation but not reversal intent.
On the 4H chart, the bearish trend remains intact with a new lower low confirming continuation. The short-term reactions visible intraday are corrective in nature and lack the strength required to shift momentum. While liquidity has been tested, buyers have not yet stepped in with conviction, maintaining ETH in a vulnerable position near key support.
Until ETH breaks and holds above the nearest daily structure, any bounce should be treated as a countertrend move within a broader downtrend. Momentum remains with the bears.
To confirm a structural shift, ETH must reclaim the daily high at 3,658.98 $, which is the top of the current range and the level that defines whether the bearish sequence continues.
The first structure at 3,287.05 $ remains the initial resistance area, and until ETH can flip it into support, bearish pressure dominates the higher timeframe.
Key Levels and Scenarios
Bullish scenario (needs confirmation)
A bullish case opens only with a decisive break above the most recent daily structure high, reclaiming short-term momentum and shifting risk toward the upper liquidity zone.
Critical levels to watch
3,658.98 $ – Daily high: Key breakout requirement
3,287.05 $ – First structure: Major resistance, must flip
3,031.44–3,014.05 $ – Head zone: Liquidity pocket
2,946.56 $ – Daily low: Main downside target
2,817.00 $ – Lower liquidity: Possible sweep zone
Trading Implications
Trend remains bearish; traders should avoid premature reversal attempts and wait for a confirmed break of daily structure before shifting bias.
This analysis is for informational purposes only and is not financial advice.