


In this ETH daily & weekly analysis for 14 December 2025, we focus on how the weekly candle close interacts with a key institutional candle zone and how the completed 1–5 Elliott impulse on the daily opens space for a corrective structure. Our technical analysis combines higher-timeframe context with short-term pattern development to map the next likely swings.
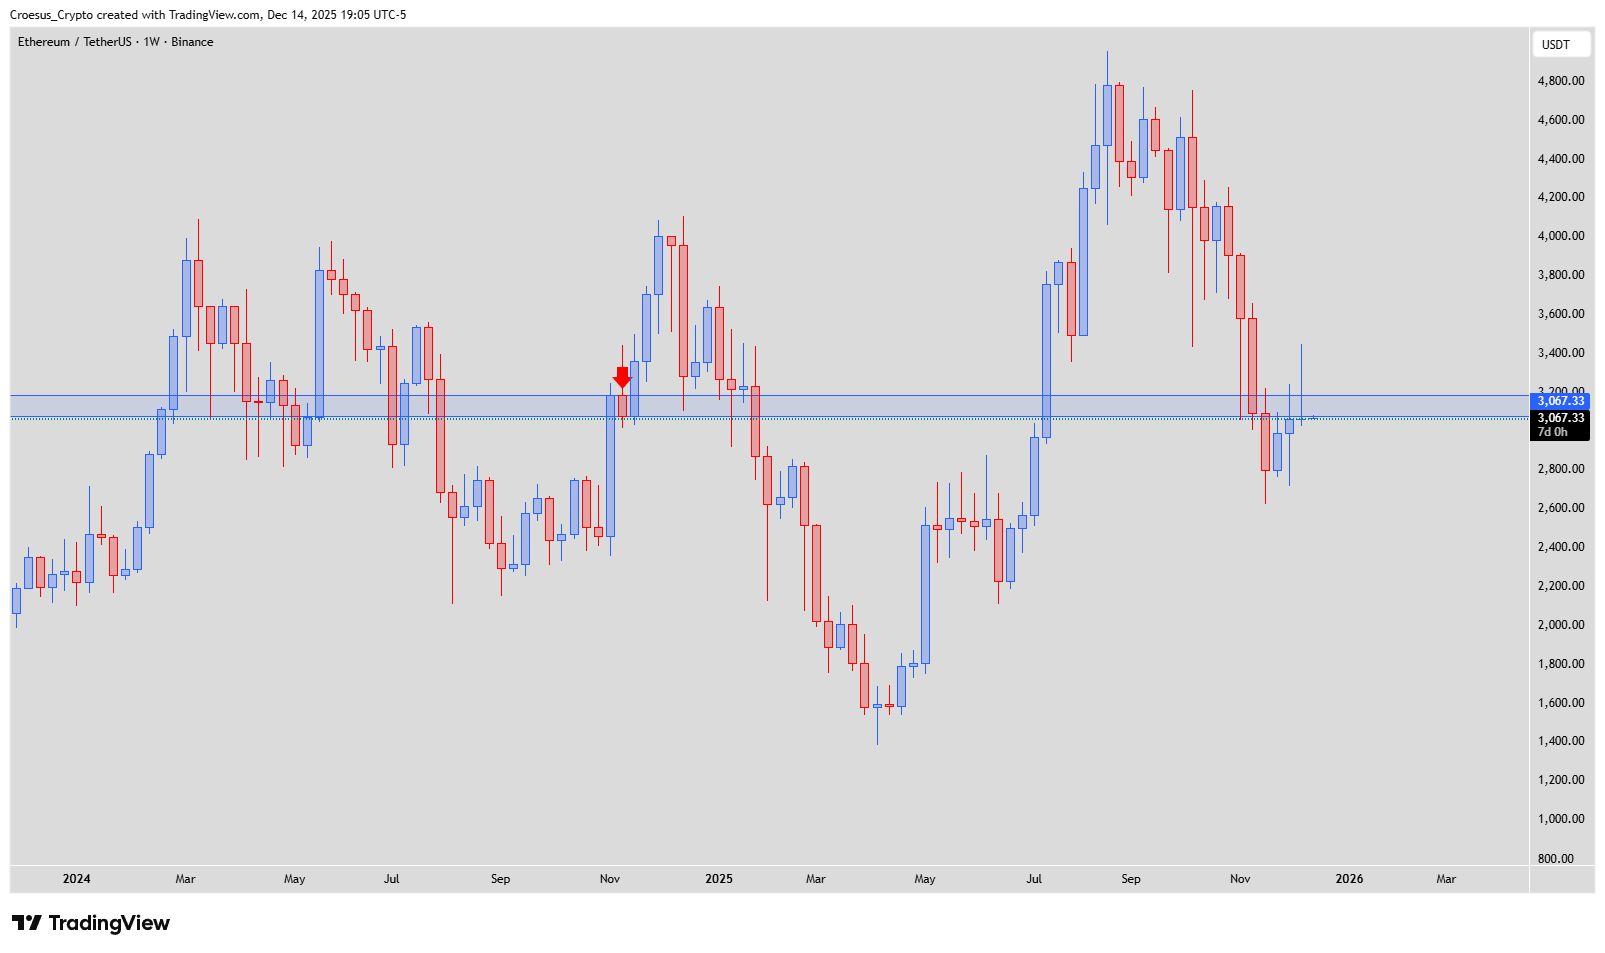
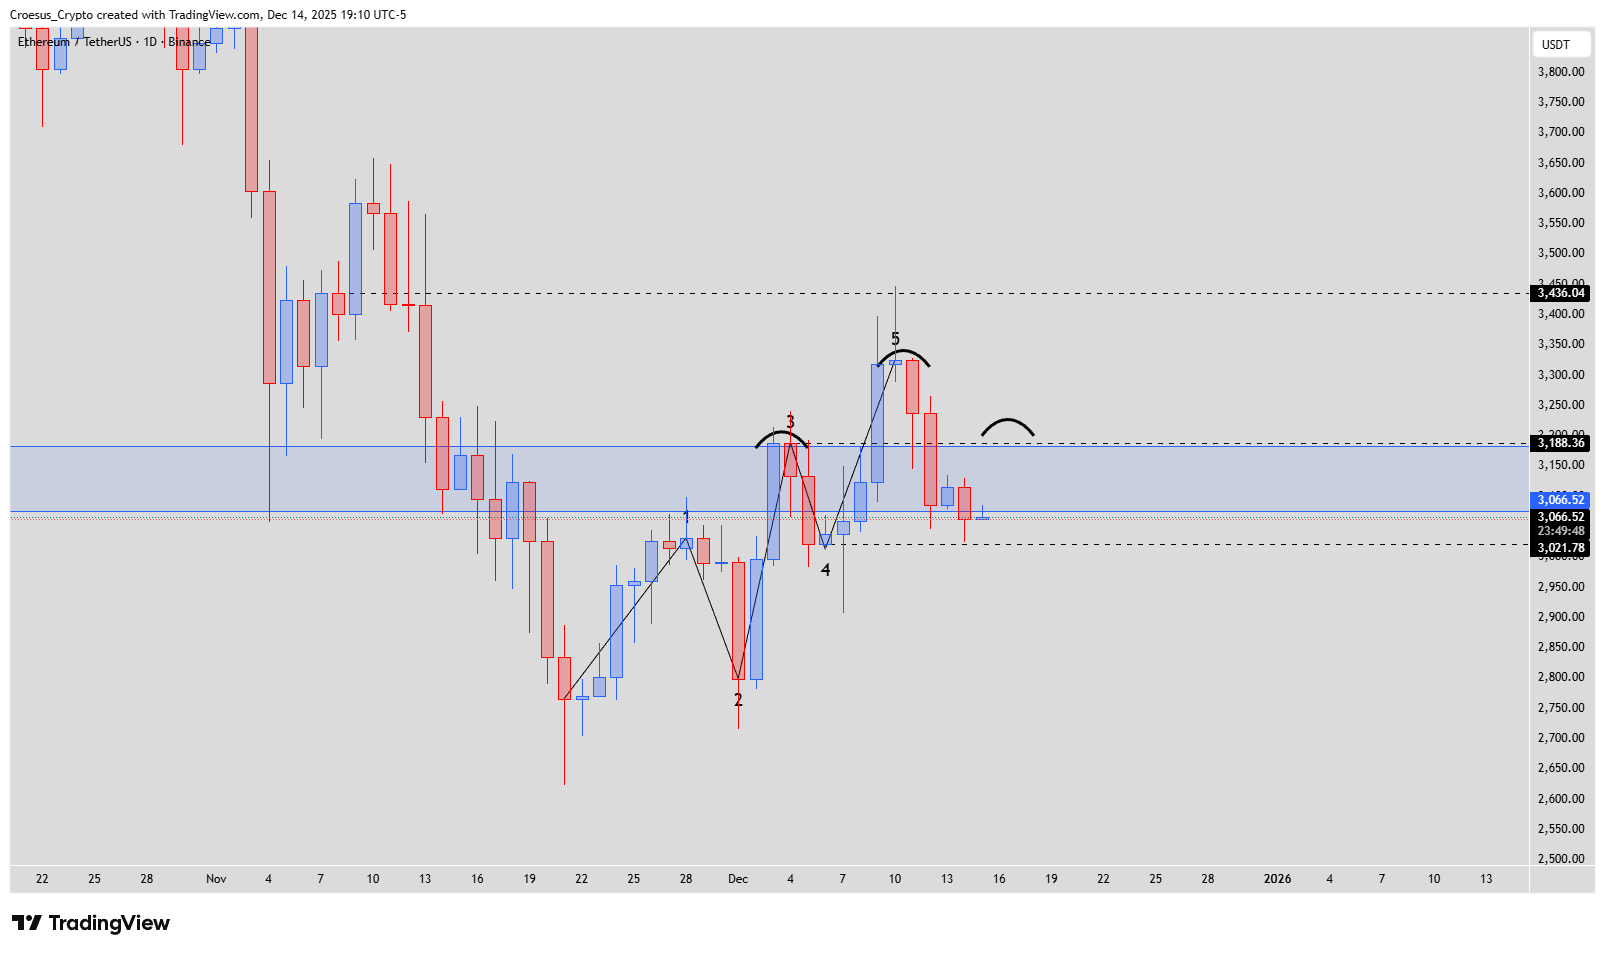
ETH weekly chart December 2025 highlighting repeated retest of historical institutional candle zone around 3,050 with latest candle closing as swing failure.
Technical Analysis Key Points
- To understand the next move in ETH, we need to look at the weekly candle close.
- Over the last three weeks, price has been retesting a particular zone, an institutional candle from the past (the blue box). This week we saw the strongest reaction. Price started the week strongly, but was rejected in the second half, closing the weekly candle with a swing failure.
- We can also see that price has completed an Elliott impulse wave (1-2-3-4-5) on the daily chart, opening the possibility for a corrective ABC move.
- We can possibly see a head and shoulders pattern forming. This is not necessarily super bearish; it could merely be a corrective bearish move after three impulsive legs up.
Market Structure Analysis
This ETH daily & weekly analysis shows price repeatedly testing a historical institutional candle zone that now acts as a major support resistance area. The latest weekly swing failure signals rejection from that zone, suggesting buyers lose momentum at these levels.
On the daily chart, the completed impulse wave (1–5) into this resistance aligns well with a typical Elliott Wave transition into an ABC correction.
A developing head and shoulders pattern inside the blue box would fit that corrective narrative rather than a full macro reversal, especially after three strong impulsive legs up.
Fibonacci retracements can help track the depth of any ABC leg, but the key signal remains the weekly rejection and neckline behavior on the daily.
Key Levels and Scenarios
Bullish scenario: If ETH reclaims the weekly swing high and closes back above the blue box, the head and shoulders fails and we can look for continuation of the prior impulse, with upside extensions guided by Fibonacci projections.
Key levels to watch
Weekly swing failure high: reclaiming it invalidates the corrective thesis.
Blue institutional zone: pivotal support resistance and neckline area.
Daily swing low (wave 4 origin): first downside objective in an ABC.
Deeper corrective supports below the blue box: potential C-wave and right-shoulder completion zone
Trading Implications
Our technical analysis suggests treating this zone as a decision area: traders may wait for confirmation via weekly closes and clear breaks of support resistance rather than front-running the full head and shoulders pattern.
This content is for educational purposes only and is not financial advice or a recommendation to buy or sell any asset.